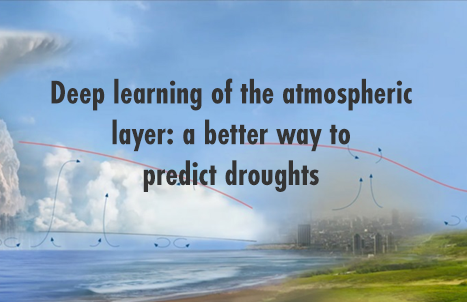
Deep learning of the atmospheric layer: a better way to predict droughts
The Earth system has been resilient for ages. It has a very turbulent past, though. Tsunamis, volcanoes, droughts, earthquakes, and numerous others. However, it has always bounced back to normal.
I am interested in talking about drought this time.
For example, Africa has experienced droughts that have altered the region’s ecology. The most severe drought to ever affect the United States was the infamous “Dust Bowl” of the 1930s.
Droughts have caused significant migration in South America and have contributed to the fall of civilizations in North America, according to paleoclimatic data.
According to research, China also faces severe droughts on a regular basis, which impact about 22.32 million hectares of cropland each year.
You would be surprised to know that droughts are an inevitable phenomenon of the environment’s natural cycle. On the other hand, it is extremely important to study their occurrence and weather pattern at that time. This helps us predict them in the future.
Recently, there were multiple reports of escalating drought conditions in some pockets of British Columbia(BC). I was curious to learn about and how GIS could help connect the dots by studying spatial temporal patterns.
A Look at BC drought from sky
British Columbia has seen the lowest amount of snow this year. In tandem with that, high temperatures and low precipitation together created the perfect climatic scenario for drought conditions to worsen.
Agriculture Canada launched this colored-coded map that shows the severity of different drought levels. Ranging from a dark maroon indicating exceptional drought to a yellow being abnormally dry, drought exists at different locations in Canada. Also, the map is a unified platform to correlate drought intensity with its duration.
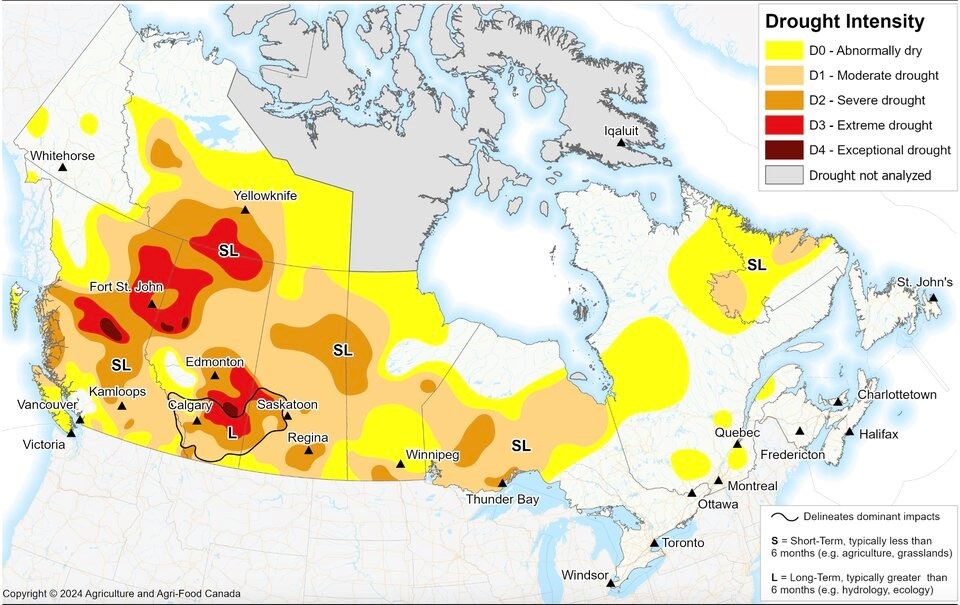
Drought conditions in Canada as of April 30, 2024. Agro-climate specialist Trevor Hadwen says that by late May, conditions in northwest B.C. had only gotten worse. Agriculture Canada
It has spread in most of the western and northwestern parts of the country, with bigger patches of extreme and exceptional drought conditions.
Ground-based investigation in drought-hit regions is a challenging feat. Putting actionable insight into perspective by ingesting satellite data is the most efficient approach. Let’s dive deeper by comparing the imagery from the years 2023 and 2024, provided by the Canadian Space Agency.
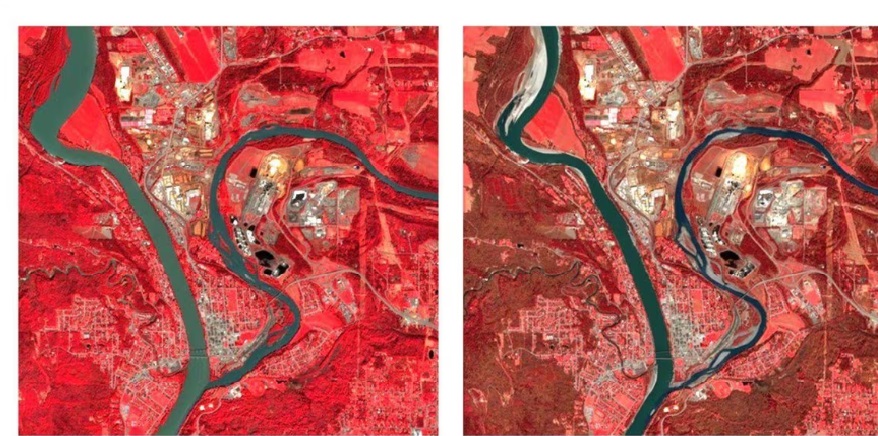
Side-by-side handout images, shown in infrared, taken by the European Space Agency’s Sentinel-2 satellite, show the Quesnel River as it meets the Fraser River in Quesnel, B.C., in May 2023, left, compared with May 2024.
As you can note, by midyear this year, the river has shrunken.
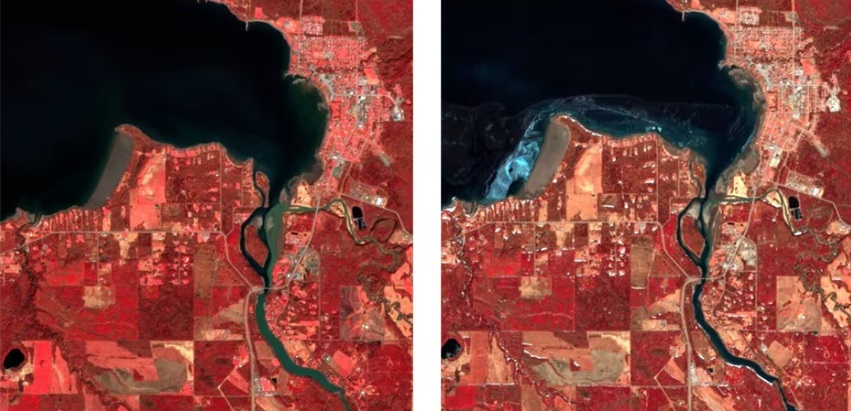
Side-by-side handout images, shown in infrared, taken by the European Space Agency’s Sentinel-2 satellite show Fort St. James, B.C., where the water appears shallower this year, right, as Stuart Lake feeds into Stuart River compared with the previous year, left. (European Union Copernicus Program; Processed by the Canadian Space Agency)
Following are the breathtaking photos of Stuart Lake and Fort St. James, British Columbia, that unmistakably show the real deal. The image on left is taken from last year’s spring and compared to this year’s spring. The coastal region has a relatively shallow bed that reflects declined water levels as it connects the upper Fraser River at Quesnel, almost 600 kilometers north of Vancouver, compared to 2024 image.
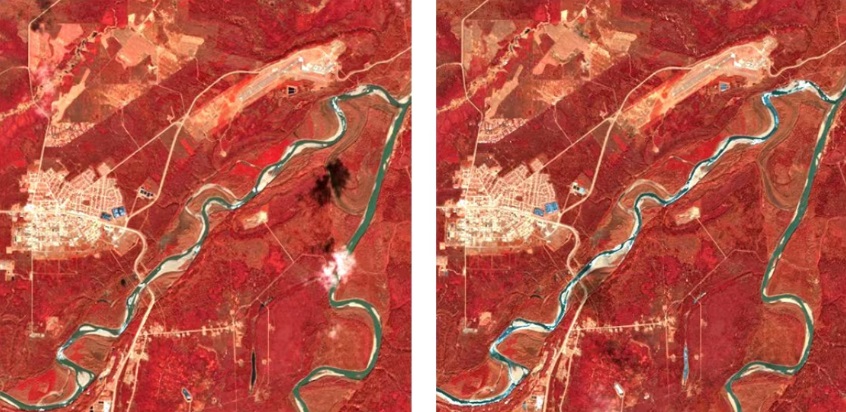
Side-by-side handout images, shown in infrared, taken by the European Space Agency’s Sentinel-2 satellite show the Fort Nelson and Muskwa rivers appear narrower, right, with more of their banks exposed compared with images taken in April 2023, left. (Canadian Space Agency/European Union/Handout Photo)
The Fort Nelson and Muskwa rivers also appear narrower, with more of their banks exposed this year compared with images taken in April 2023.
Can we predict droughts using Deep learning?
Weather patterns are quite volatile these days, so making certain forecasts is tricky. When it comes to managing and predicting droughts, it is no less daunting.
To better explain how it can be possible to do so in the future, I would like to bring forward a research study from Lincoln Laboratory at the Massachusetts Institute of Technology (MIT).
Lincoln Laboratory researchers have been studying weather and climate utilizing one of the most important components in “the planetary boundary layer (PBL)”: its height.
Despite the troposphere being thought to be the lowest, PBL, according to the researcher, is the lowest layer of the atmosphere, where surface and atmosphere communicate with each other. The planetary boundary layer is where moisture and heat exchange take place and determines the intensity of climate and weather changes.
Studying 3D-scanned features of the atmosphere created using machine learning models for four years helped scientists ascertain the vertical structure of the atmosphere. This allows for a more precise drought forecast.
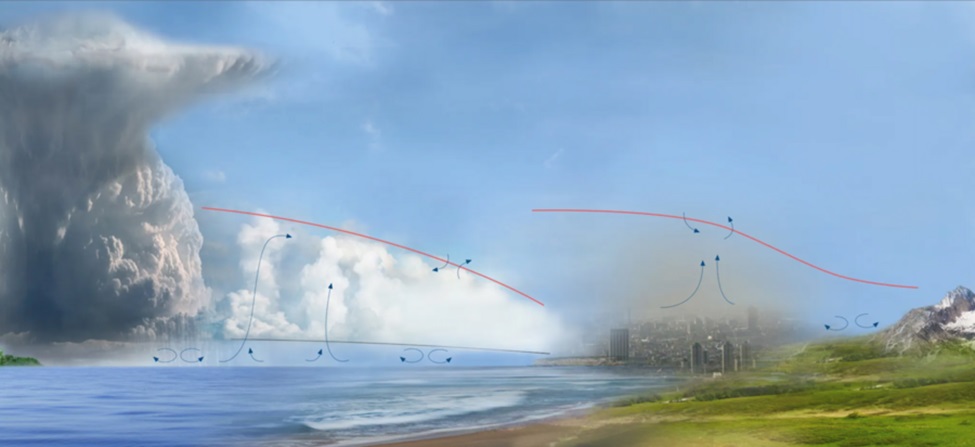
This schematic of the planetary boundary layer (red line) shows exchanges of moisture and movement of aerosols that occur between the Earth’s surface and this lowest level of the atmosphere. Lincoln Laboratory researchers are using deep learning techniques to learn more about PBL features, important for weather and climate studies.
This PBL-focused research built for NASA’s mission consists of time-resolved observations of precipitation structure and storm intensity with a constellation of smallsats (TROPICS) as well as Aqua, a satellite that collects data about Earth’s water cycle, such as ocean temperature, precipitation, and water vapor in the atmosphere.”
To take this research to the next dimension, PBL researchers partnered with NASA Goddard Space Flight Center to further bolster their efforts to determine the height of PBL more accurately. Their key objective was to fortify the drought monitoring system.
The lack of humidity at the PBL level is the most reliable predictor of drought.
Validating the algorithm forecast with National Oceanic and Atmospheric Administration (NOAA) data, NASA as well as data gathered directly from PBL using radiosondes will determine the technique’s accuracy and considered a kind of ‘ground truth’, says the researcher.
The enhanced neural network algorithm approach is promising for drought prediction and is hoping to provide a series of accurate drought predictions in the future.
Can this research prove to be a game-changer for drought prediction technology?
Can we adapt this advanced learning of the atmospheric layer to predict drought in Canada before it impacts our communities and livelihoods?
References:
https://climatereadybc.gov.bc.ca/pages/drought-water-scarcity
https://www.cbc.ca/news/canada/british-columbia/drought-unfamiliar-territory-1.7199512
https://news.mit.edu/2024/using-deep-learning-image-earths-planetary-boundary-layer-0418
https://education.nationalgeographic.org/resource/understanding-droughts/


