Canadian Geospatial Digest for September 23rd, 2024
- An online map tracks Climate-related disaster cost.
- University of New Brunswick researchers participate in AI-based projects
- Living Lakes Canada Maps helped wildfire fighters
- Eating disorder mapped using GIS
- Language map for Toronto: 54 languages mapped
An online map tracks Climate-related disaster costs
The Canadian Climate Institute’s (CCI) new tracking tool is based on attribution science and can track various climate change disaster costs across Canada. In the past year, 60 news articles and trade journals have discussed the national costs of climate-related calamities; these are currently linked in CCI’s tracker.

courtesy: Canadian Climate Insitute
The tracking tool maps every extreme climate-related catastrophe that has occurred recently.
By spotlighting the substantial damage that are caused by floods, droughts, and wildfires across the nation, the institute’s research is looking for to raise awareness. Also, more climate-resilient communities can be built nationwide with its support from and the government can use it to actively prevent these financial losses.
University of Brunswick researchers participate in AI-based projects
University of New Brunswick (UNB) researchers will share their knowledge in fields like cybersecurity, AI-based change detection, and mapping ocean floors.
Furthermore, scientists from the Research Institute for Data Science and Artificial Intelligence and the SPECTRAL Spatial Computing Research Centre are currently looking into ways to participate in these and other similar projects under PORT WATCH banner.
The increased financing support will provide a significant boost in addressing complex challenges and demonstrating the potential of industry innovators and academic specialists. “In order to develop a proof-of-concept solution for complete situational awareness of the underwater domain as well as the surface of the water,” the PORT WATCH program is attempting to “integrate artificial intelligence, subsea mapping and remote sensing, change detection, and other components.”
Living Lakes Canada Maps helped wildfire fighters
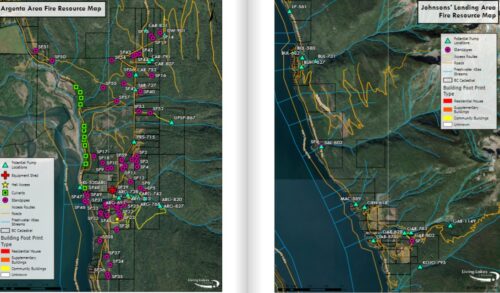
Living Lake Canada (LLC), in collaboration with the Argenta Safety and Preparedness Society, developed a map covering water resources and small details about the community of Argenta.

Argenta Area fire resouce Map
Using this comprehensive map, wildfire fighters could access water resources faster and understand the community area better. The maps cover identified high-pressure standpipes, ideal pump deployment sites in streams, locations of buildings and residences, and access routes. Tools like this could boost the coordination between the local community resources and Wildfire fighting Services.
Eating disorder mapped using GIS
Using Geographic Information System (GIS) technology, a team of researchers mapped the geographic degree of eating disorders and analysed their closeness to specialized eating disorder services for the province of Ontario.

Specialized public eating disorder services in ontario and clusters of eating disorders scores in ontario
Using geospatial analysis techniques, substantial spatial clusters indicating higher eating disorder scores in rural areas and areas with fewer specialist resources have been identified. Similarly, the study demonstrate differences between rural and urban areas, showing that rural areas have a higher incidence of eating disorders. There was no correlation between distance or time to services and eating disorder symptoms.
Language map for Toronto: 54 languages mapped
Alex McPhee, a self-taught mapper from Val Marie, Saskatchewan, created a map of Toronto’s linguistic demography, demonstrating the city’s diversity through 54 small maps of different languages spoken there other than English. McPhee constructed the maps with open-source software and public domain resources.

The Toronto mother tongues map created by Saskatchewan cartographer Alex McPhee
The cartographer highlighted the 2021 Canadian cenus as well as his May vacation to the city as his inspiration. McPhee has elegantly exhibited the linguistic clusters, graphically portraying the story of immigration and the emotion of people’s preferance to be closer to their fellow nationals as they come in this new land of hope.


