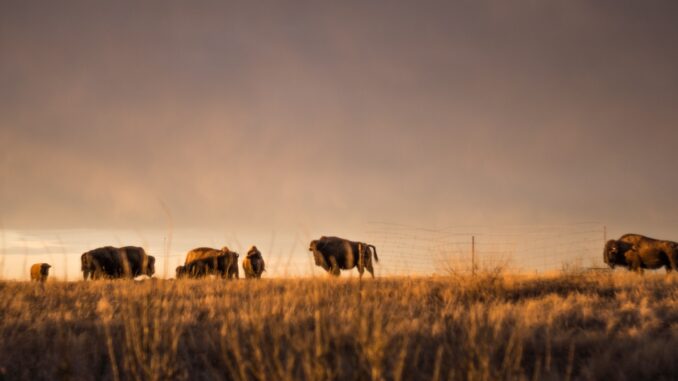
Carbon soil mapping project aims to help beef producers trap carbon, fight climate change
“Our grassland soils hold large amounts of carbon, and by increasing the amount of carbon that’s held in those soils, we can help to mitigate the effects of climate change” Cameron Carlyle, associate professor of agriculture, food and nutritional science department at the University of Alberta

Carlyle, one of the research leads and his team are working on a project of mapping and measuring the carbon in native grasslands, tame pastures and hay lands throughout the southern half of Saskatchewan. They teamed up with the University of Saskatchewan’s researchers for data collection and mapping across an eight million hectare site using machine learning.
Also, this project seeks to determine the best practices for land management to help hold carbon in the soil. Therefore, Carlyle’s team plans to talk with livestock producers throughout the vast project area to learn more about their land management practices.
Read more here.
MDA teams up with NGO to use historical satellite data to help combat illegal fishing
Global Fishing Watch, a monitoring illegal fishing organization, recently announced that it will use 14 years of archived MDA’s Radarsat-2 radar satellite to determine past unmonitored fishing activities. The research and innovation director of this organization believes monitoring activities at sea has been so challenging until now and the analysis will help guide offshore patrols and other enforcement activities such as finding where and when coast guards deploy vessels and aircraft.
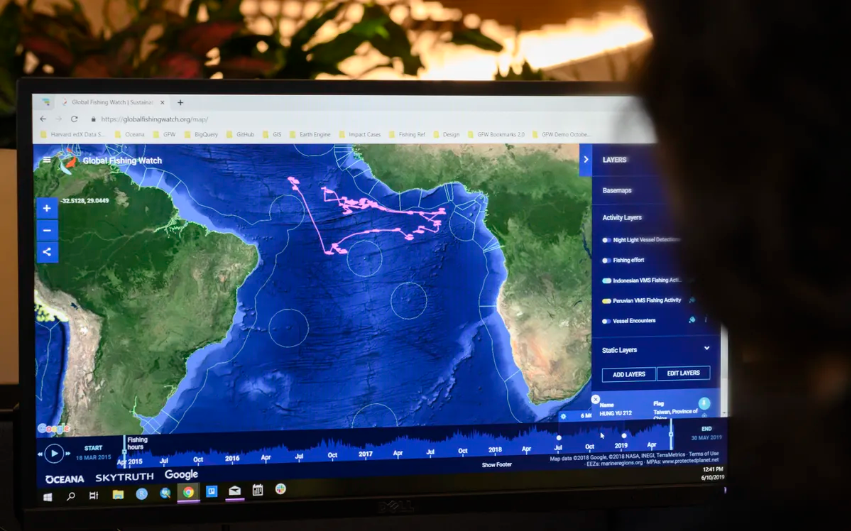
Global Fishing Watch previously used data from the European Space Agency’s Sentinel-1 radar satellite but MDA covers a greatly larger area as well as a longer duration. The satellites are able to catch dark vessels, so it provides a more comprehensive fishing activity report than an automatic identification system (AIS) alone.
Indigenous Mapping Workshop, 2022IMW: Alberta, November 21-23, 2022
Indigenous Mapping Workshop has held two successful online events over the past years. This year, they are planning to have their first hybrid event. Indigenous Mapping Workshop 2022 which is called 2022IMW will be in Alberta from November 21 to 23.
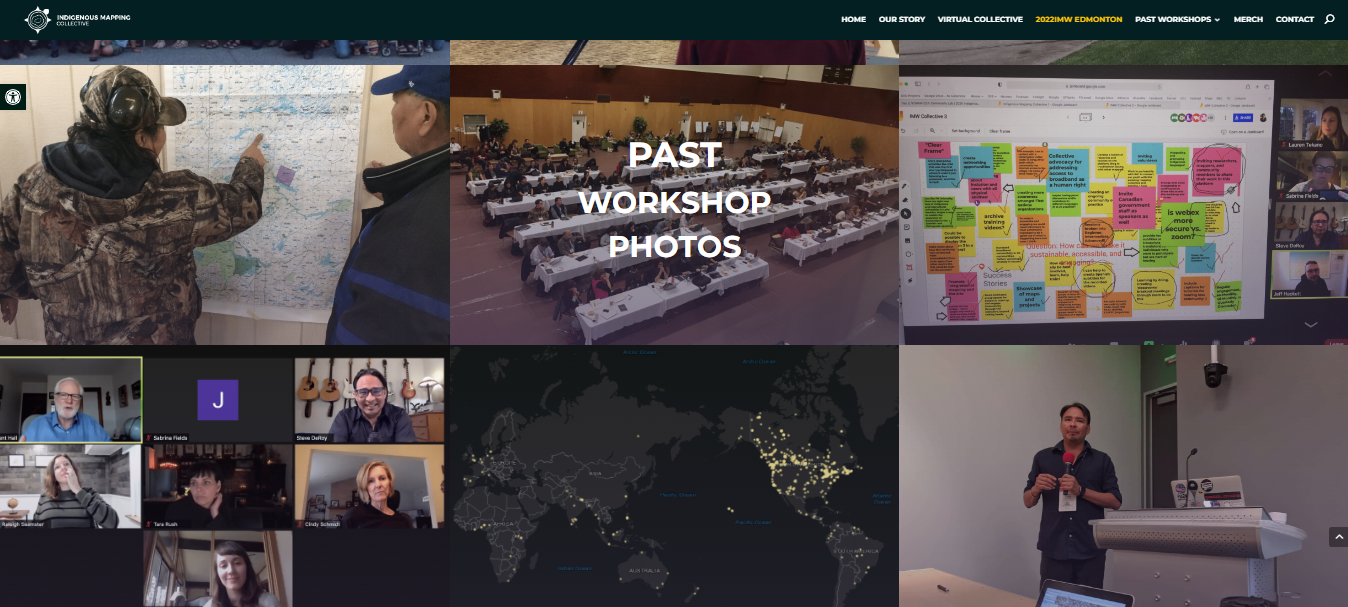
Building connections and reinstating relationships through in-person engagements will be the focus of the 2022 workshop while all local health and safety protocols will be followed. However, IMW programming will also be available online for those who can not attend in person. The purpose of the Indigenous Mapping Workshop is to provide Indigenous peoples across Turtle Island with the required tools and training for their storytelling. Read more here.
Melanoma map shows skin cancer is on the rise in Canada
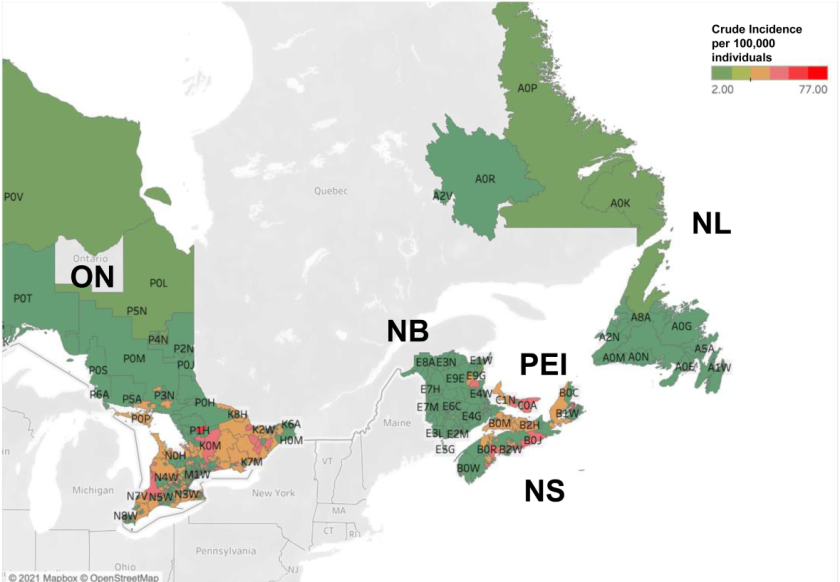
A new McGill University research reveals that cases of a deadly form of skin cancer, melanoma, are increasing in Canada. The maps below show that southern and coastal areas are most at risk. The highest incidence rate of melanoma in Canada was in the maritime provinces of PEI and Nova Scotia while the prairies provinces and Newfoundland and Labrador had lower rates than the Canadian average. Read more here.
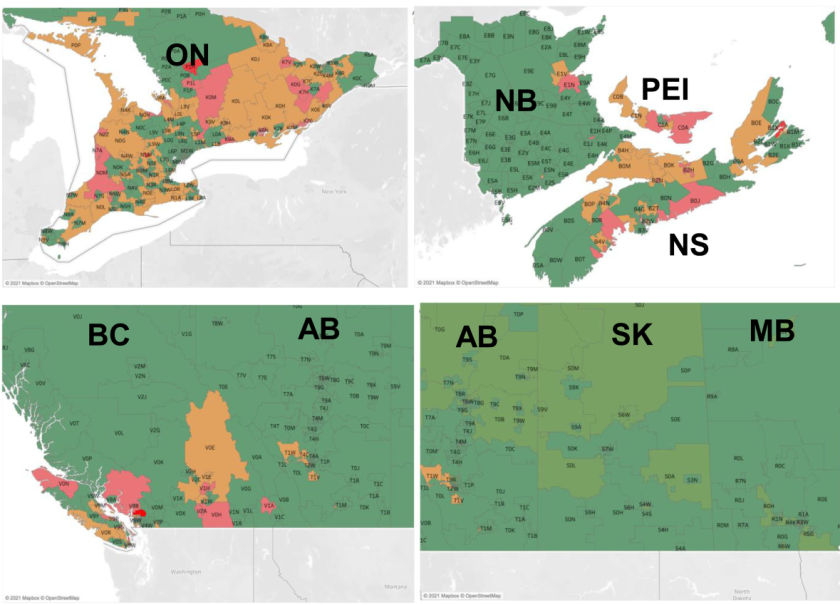
Images show the Incidence of melanoma skin cancer across Canada. Source: https://www.frontiersin.org/articles/10.3389/fmed.2022.830254/full
Mapping Bicyclists’ Greatest Dangers in Santa Barbara
Trisalyn Nelson, UCSB geography professor had a dangerous biking experience at an intersection in Vancouver, British Columbia. After this scary situation, she decided to provide a platform for cyclists to add their dangerous encounters locations as points on the map.
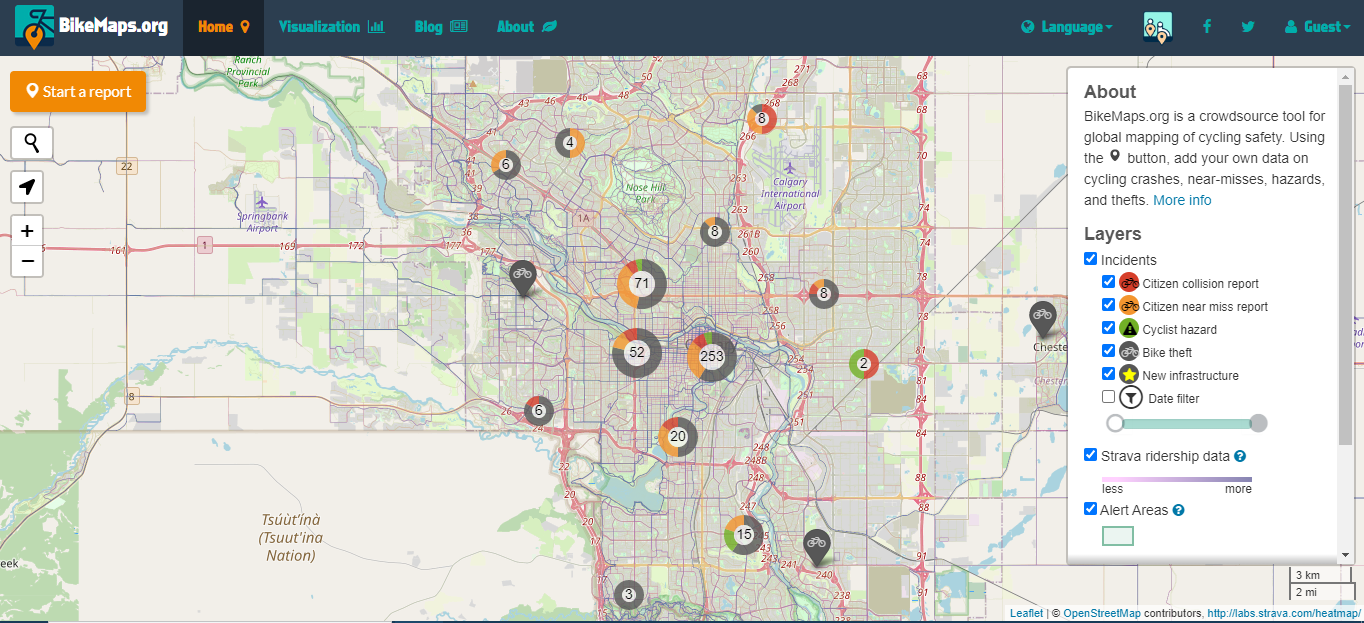
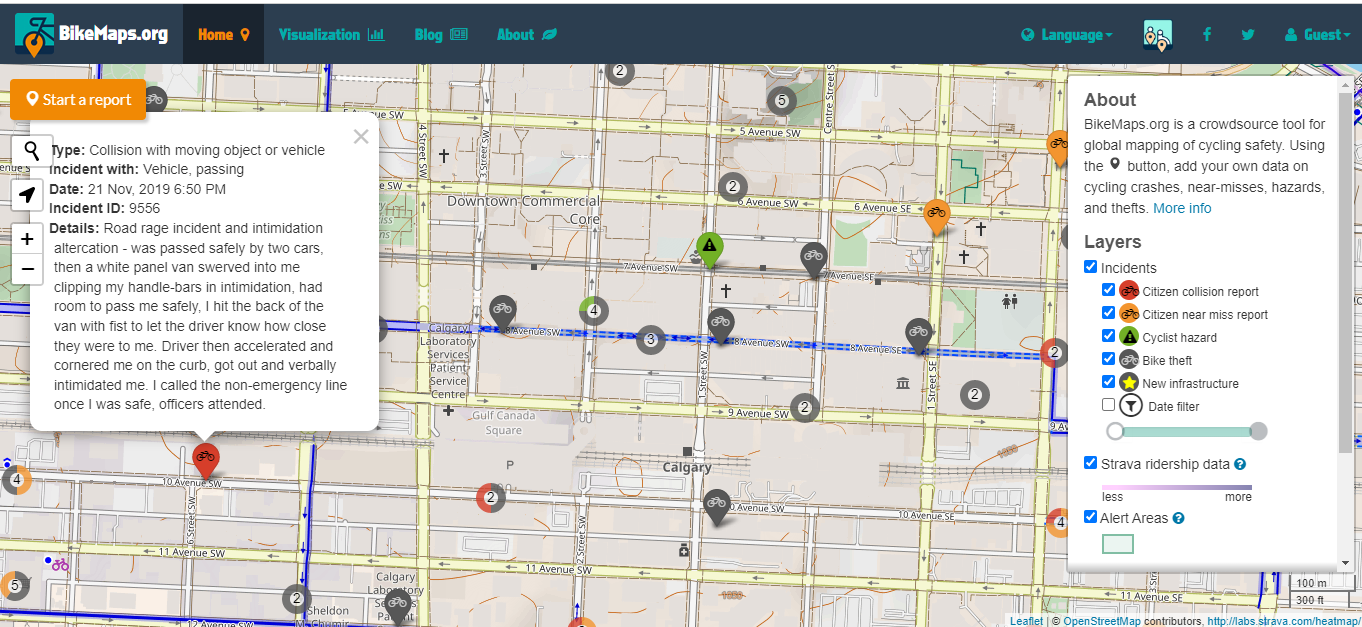
Now, BikeMaps.org represents 11,000 data points from 40 different locations telling a story of a crash, collision, stolen bike or just a very dangerous location for cyclists. For instance, the first image below shows around 450 dots of dangerous encounters for cyclists in Calgary. The second image, displays cycling stories in downtown Calgary, the red circles show collisions and by clicking on each dot, a window pops up with more information about this collision.
Read more here.

Be the first to comment