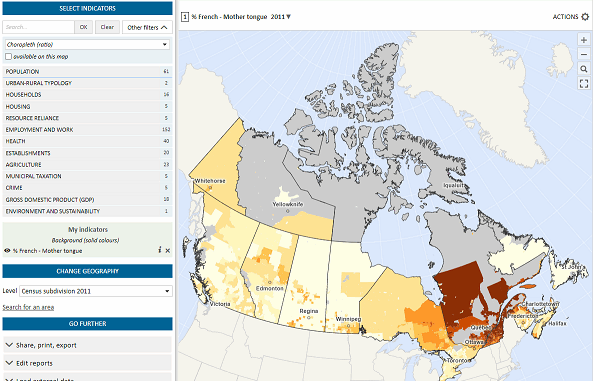
The Géoclip observatories are web applications for statistical mapping to promote the analysis of territorial data sets. A Géoclip observatory is where territories, geographical data, statistical results and metadata meet. The purpose of such an application is to enlighten the general public, decision-makers, elected representatives, journalists and others about territorial knowledge.
The official Géoclip website showcases the product/software, our skills and the services our dedicated team provides. There are several thematic observatories freely available: Europe Découverte, France Découverte, the French voting observatory, etc.

Géoclip is used by a wide variety of public structures such as cities, provinces, ministries, etc. It is not only suited to address general topics use, but also recognized for more specific use-cases addressing different sectors of activities: health/social, town planning, banking, facilities, environment, etc.
Designed by statistical experts, Géoclip is about quality of data and data-visualization outputs, semiology standards, usability, ease of navigation, performance, and sharing of statistical information between users.
Géoclip observatories are able to manage thousands of rigorously documented indicators organized into one or several themes.

Whatever the device – large screen, tablet, phone – Géoclip’s interface is automatically adjusted to provide a high-quality navigation experience. Interactions maximize the discovery of statistical indicators through thematic maps, charts, graphs, dataviz, etc. Géoclip is a multilingual tool to reach any targeted audience. Banners, logos, images and other aesthetics can be customized to fit with your corporate identity. The colorful atmosphere is created by paying special attention to details. Texts are fully customizable, and the interface designed according to accessibility guidelines.

Many functionalities are offered to the user so that he/she can interact with the data: configuration of thematic analyses, discretization modes, distribution analysis, spatial smoothing, reprojection, choice of color palettes, anamorphosis maps, temporal animations, and access to tabular data, filtering / queries, export of Excel data, etc. Settings can be saved and reused. Géoclip complies with high confidentiality requirements related to statistics. Privacy rules can be specified in order to prevent direct or indirect identification. Maps can be printed out with different layouts as PDF files and exported in PNG format, or as a vector file (SVG).
According to the nature of the data, Géoclip offers the best cartographic representation: choropleth analyses (ratios), proportional circles, pie charts, colored circles, typologies, fluxes, linear, zoning coloring, grids, etc.

Designed in the true spirit of opendata, Géoclip offers raw data for download or data enhanced by beautiful interactive renderings. A Géoclip observatory supports digital maps such as OpenStreetMap and other services based on OGC standards, image content via WMTS/WMS but also in TJS, which enables the exchange of statistical data and rigorously documented metadata. Maps can be shared on social media like LinkedIn, Twitter, Facebook, etc. Uploading your own tabular data by simple copy/paste, even with a time axis, is a key Géoclip feature to leverage the power of the software in record time. In one click, personal data may be aggregated and visualized on encompassing territories and/or cross-referenced with other indicators available in the observatory. Several videos illustrate these functionalities.

The whole potential of Géoclip comes from its ability to offer content at different territorial scales: from the finest for a local analysis, to the most aggregated for a smoother effect. Users can customize their study area simply by clicking on the map, creating multicriteria queries, making a circular selection, or from an intelligent search tool through encompassing zoning proposals.

Géoclip is a tool able to generate reports. It embarks a set of data-visualizations including tables, charts, maps and comparison options to provide compelling and dynamically calculated data about any territory of interest.

Graphical representations have been carefully designed and configured to ensure legibility and high-quality of rendering matching the type of data with the best corresponding representation mode.

All graphics are interactive and may be export to SVG vector format while the data itself may be viewed and exported as well. Data can also be filtered or animated according to data availability, with transition effects to better understand the data. Customized reports may be printed in PDF format and exported in Excel format.

Géoclip is designed to work with reliability intervals to frame values and offers suitable representation tools to each indicator:


A Géoclip observatory is a complete geostatistical portal that provides user account management, fine-grained management of access rights, links to LDAP directories and traffic monitoring tools, a news feed, a workspace for customized articles, a user help section, legal notices, etc. Personal data and cookies are subject to special care and comply with European requirements (RGPD). The application is hosted on a pre-production instance and a production instance. A dedicated module gives the possibility to instantly update Géoclip observatories in one click, enabling the rolling-out of new statistical data on D-day.
Today, Géoclip Air, a Ciril GROUP software, is the most advanced version of the product. It benefits from nearly twenty years of experience in the field of territorial and statistical observation. Géoclip is also known for its velocity, safety, and ability to handle heavy user traffic.
Géoclip has been quickly implemented in Canada, it’s already at an early stage, allowing several Canadian organizations to publish and share data with as many people as possible.
Being such a large country, Canada represents a true challenge in terms of representation and geographical projection. A growing number of Géoclip projects have seen the light amongst which projects with the National Institute of Public Health in Quebec (INSPQ) and, more recently, with the Canadian Ministry of Agriculture, Rural Secretariat for the online publication of the Community Information Database.


Be the first to comment