
Using Data Visualization to Quickly Forecast Avalanches and Enhance Public Safety
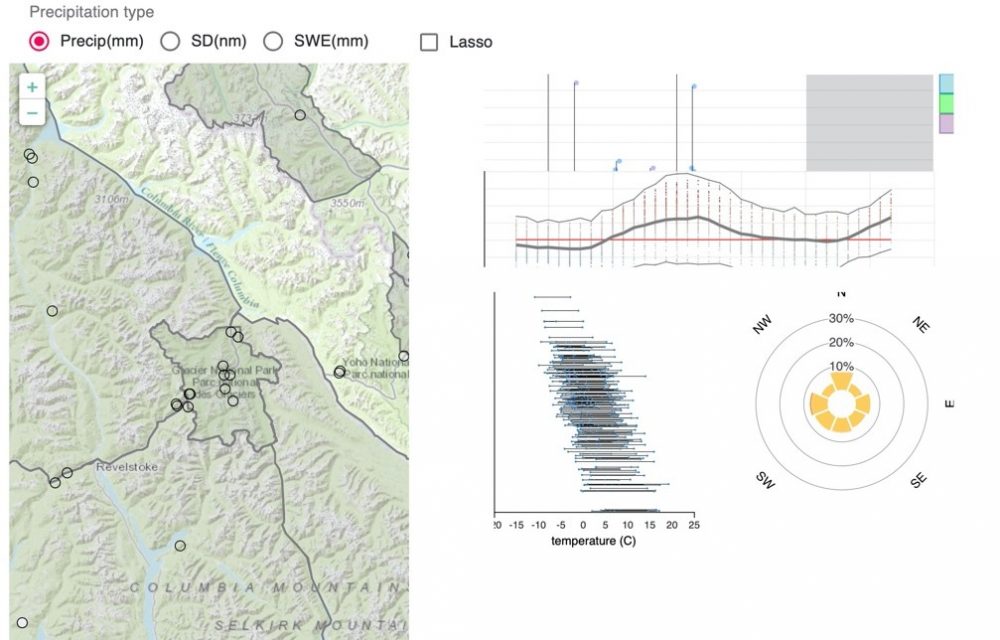
Avalanche prediction requires location and elevation specific weather data that is most often only available from multiple sources and in multiple formats. This makes quickly predicting avalanche risk challenging for forecasters.
The Canadian full stack software development company Two Story Robots, based in Kamloops BC, recently worked with the Avalanche Canada to develop a single application that aggregates weather and related data from many different sources into a single, easy to use interactive tool. A data scientist from Simon Fraser University, also worked on the project. (SFU has an Avalanche Research Program – SARP). The user only has to know the location that they are interested in, and the application determines out the best source of data.
Article: https://www.twostoryrobot.com/blog/using-data-visualization-to-quickly-forecast-avalanches/
An interactive map shares the stories of Sixties Scoop survivors
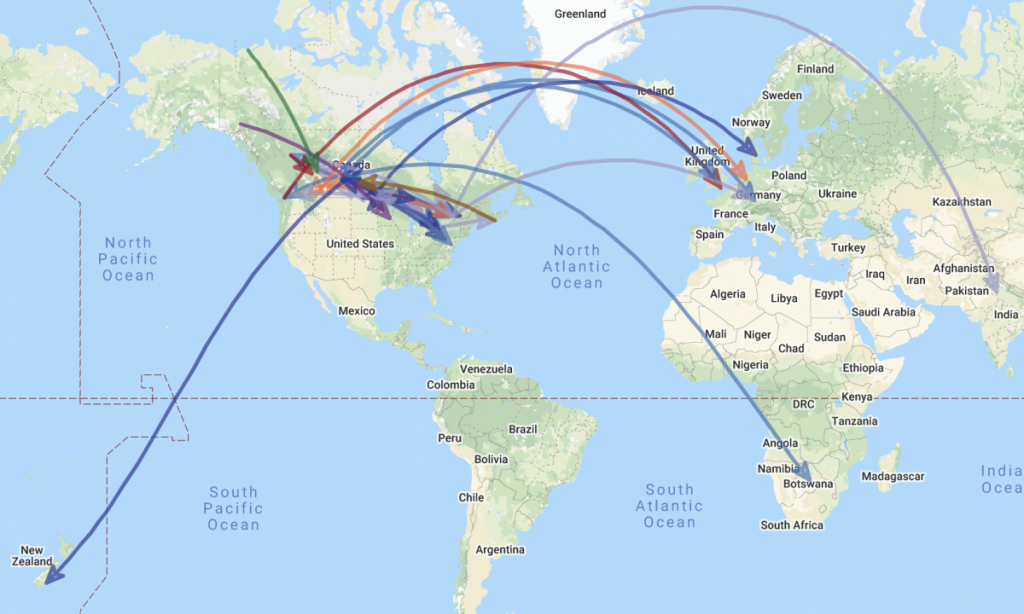
After almost three years in development the interactive map of the origins and end points of Sixties Scoops survivors is live. In our own Words: Mapping the Sixties Scoop Diaspora illustrates the geographic impacts of Canada’s mid-1900’s common practice of removing indigenous children from their families and adopting them out of their home communities into non-indigenous families. The removals occurred at rates many times higher than with children from other demographics. This interactive map, which allows survivors to input their own data and stories, illustrates that survivors ended up as far away as New Zealand and Botswana.
People involved in the project:
- The project started when Colleen Hele-Cardinal, the founder of the National Indigenous Survivors of Child Welfare Network spoke with Canadian Geographic about having a map that would tell survivors’ stories.
- The map was coded by two UBC Okanagan researchers. Nick Black a men’s health consultant, and Dr. Jon Corbett, Associate Professor of Geography with the Institute for Community Engaged Research (ICER).
- University of Regina social work professor Dr. Raven Sinclair has been a champion of the project.
- Sixties Scoop: https://indigenousfoundations.arts.ubc.ca/sixties_scoop/
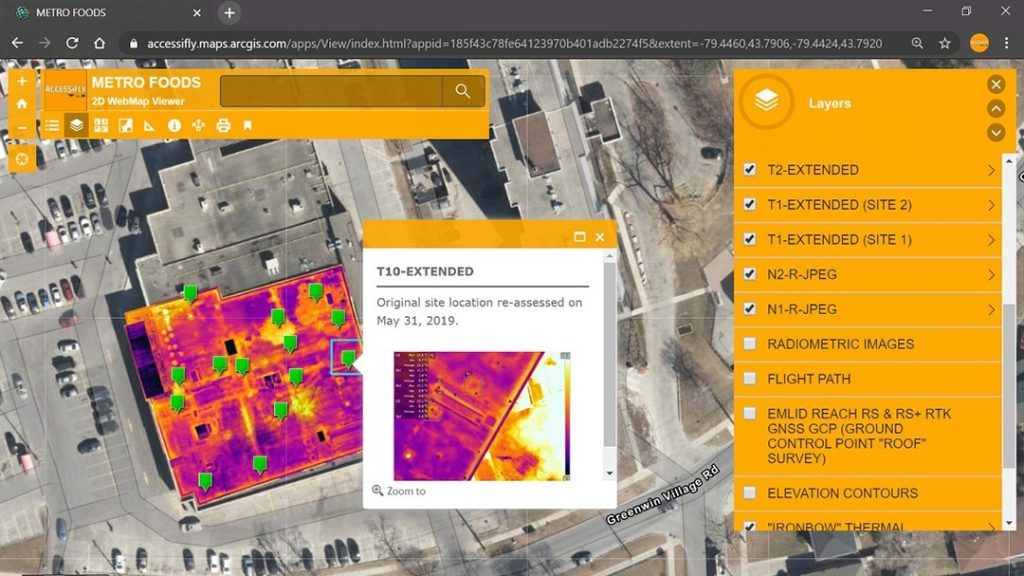
Toronto based building sciences firm ACCESSiFLY uses ArcGIS Drone2Map to improve accuracy and efficiency of drone collected thermal infrared imagery
Credit: https://www.esri.com/en-us/landing-page/product/2020/accessifly-case-study
The use of drones as a remote sensing platform is rapidly increasing. However some challenges still need to be overcome. For example, thermal infrared images can’t be georeferenced in the same way as optical images and data. The problem comes from thermal cameras not being able to see things with non-uniform temperatures. Integrating thermal imaging into a complete 3D scene or 2D map would cause the resulting scenes and maps to look bent or appear to float.
Toronto based building sciences firm ACCESSiFLY provides integrated GIS, commercial inspections, and building sciences services, and extensively uses drones to do so. By using the newer Esri drone specific product ArcGIS Drone2Map, trial and error, and a custom housing filled with silicone gel or dry ice ACCESSiFLY has made drone collected thermal imagery more efficient and accurate. Now they only typically require one, not two drone flights, and results can be shown to clients in half the time, with a great increase in accuracy.
Canadian Government Announces an upcoming contact with MDA to build the Canadarm3

On June 26th, the Canadian Government announced a future contract with MDA to build the Canadarm3. The Canadarm3 will be located on the Lunar Gateway – a space station in lunar orbit 1/5 the size of the International Space Station. When built, the Lunar Gateway will allow continuous earth and space remote sensing imaging outside of the Earth’s magnetic field. Next Gen AI and other advanced software will allow the Canadarm3 to operate independently of humans after receiving instructions from astronauts on the Lunar Gateway or from Earth. As the Lunar Gateway will not always have a crew onboard the Canadarm3 will be essential for maintaining the Lunar Gateway when no crew are on board.
Though MDA is the main contractor for the Canadarm3 project, many smaller suppliers across Canada will benefit though the application of the Government’s “Industrial and Technological Benefits (ITB) Policy.
Be the first to comment