
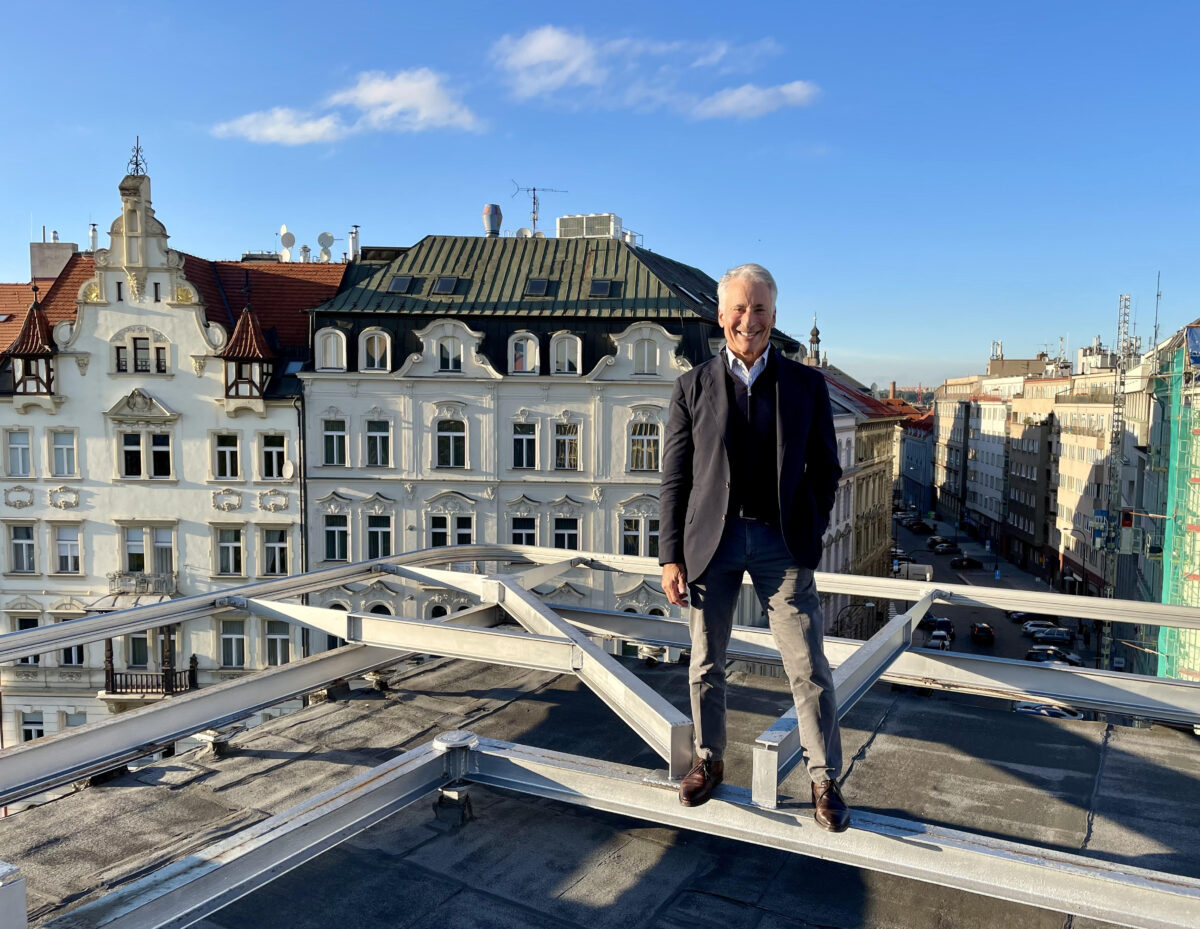
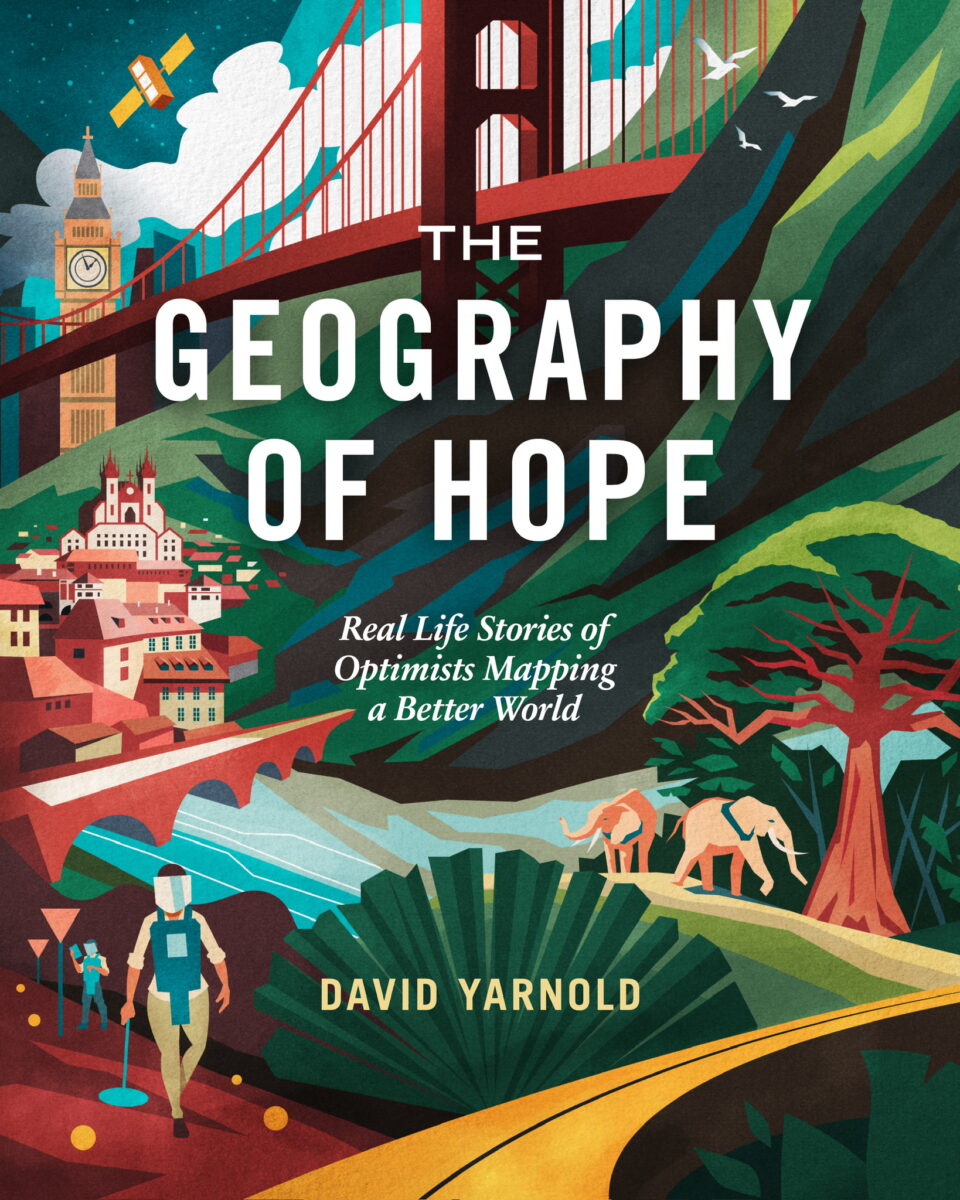
David Yarnold has authored many impactful stories, including the Pulitzer Prize-winning report on the 1989 Loma Prieta earthquake. As the President and CEO of the National Audubon Society, he championed environmental stewardship. In this interview, Yarnold discusses his book, The Geography of Hope, which draws on his powerful storytelling to explore how GIS is addressing complex global challenges.
The book is scheduled for official launch on October 1.
Excerpts
What sparked your journey from Pulitzer Prize-winning journalist and conservation leader to writing a book about GIS?
I spent a good part of my career in Silicon Valley, so I’ve always been drawn to cool technology. Back then, we had delegations from other countries visiting our newsroom, asking how they could become the next Silicon Valley. So, my interest in tech was always there. When I was at Audubon, I started feeling a bit disconnected because there wasn’t much technology involved in our work. But that changed when I attended my first Esri User Conference in 2011. I saw incredible stories – GIS transforming law enforcement in Philadelphia, building new ports in Amsterdam, or mapping areas vulnerable to rising sea levels in the Pacific. It was fascinating.
But the real turning point for me came in 2015 when [Esri founders] Jack and Laura Dangermond were awarded the Audubon Medal. At the ceremony, Dr Bruce Aylward from the World Health Organization gave a powerful talk about how GIS played a key role in the fight against Ebola. That’s when I truly saw how this technology could be used to address global challenges.
What really got me excited was the idea of telling stories about people using GIS in complex environments, where different motivations, interests, and stakes come into play. I wanted to know what it takes for people like Dr Aylward to succeed in such high-stakes situations.
When I spoke with Jack about writing the book, I explained that while the tools are amazing, the real story is how people use them in challenging contexts. I wanted the book to be accessible to a general audience. It’s something that GIS experts could share with their families or friends – people who might not understand the importance of what they do. And for the general public, it’s about introducing them to this technology that quietly shapes the world around them.
Jack was completely on board. Little did I know that conversation would set me on a path for the next three years!
Accessibility is one of the most striking features of the book, which comes from the strong focus on the stories of the people behind the technology. How did you decide which individuals to feature?
I started with a rough framework, knowing how many chapters I could realistically write. I decided to use Esri’s market verticals, which guided me to the right people to talk to. I applied four criteria: the stories needed to represent their vertical; demonstrate innovative use of technology; involve compelling organizational applications; and feature engaging individuals.
I started the project in April 2020, spending the first three months figuring out the stories. I had given myself permission not to have all nine stories upfront… If I could nail down five or six, I would start. I did countless background interviews, and had to sift through a lot of recommendations. For instance, someone mentioned a father-daughter team [Jesus and Sophia Garcia] that led the redistricting effort in Bakersfield.
I saw the Prague team present at the 2021 UC and dug deeper into that. Then Prague came up again in conversations, and it became clear it was a strong story.
Prague was one of the key stories from the start. And my first reporting trip was actually to Prague via Geneva, where I was also covering the World Health Organization. When I arrived in Prague, I uncovered this fascinating story about ‘democratizing democracy’. Prague, with its complex political system, was doing groundbreaking work in citizen engagement, and it turned the GIS experts into unlikely heroes. And they were facing threats from bureaucrats and corrupt politicians, which gave the story a dramatic twist.

What wasn’t widely known was that the former head of Prague’s GIS organization had been the mayor. He had developed a 12-point plan to create the IPR [Institute for Planning and Development], bringing together philosophers, business leaders, and lawyers to discuss the future of Prague. The more time I spent there, the more this heroic narrative emerged.
It’s obvious the Prague story is close to your heart. If you had to pick another, what would be another standout story for you?
Honestly, and this might sound a bit corny, but I love all the stories for different reasons. One that stands out to me is the story about the U.S. Census and how Deirdre Bishop has transformed it, along with Jesus and Sophia Garcia’s work in Bakersfield. What’s interesting about Bakersfield is that it’s in one of the most conservative parts of California, where a white minority controlled nearly every elected body for years. But it was the Latino and Sikh communities coming together to drive the redistricting effort, that shifted the power dynamic, leading to a more diverse City Council and the election of Manpreet Kaur. Now, you’re seeing a council that’s more progressive in a historically deep-red, conservative region. It’s a real shift in power and a moment of hope.
Then there’s the chapter on businesses. That was tough to write – companies weren’t eager to talk; they treated their use of GIS like a trade secret. I eventually found a way in by digging through keynotes, and I came across one from the insurance industry, which talked about imaging every inch of America. My first thought was: “Wait, you want to do what!”
That became a great example of how GIS is transforming the insurance industry, from Lloyd’s of London to Silicon Valley startups. It also opened up stories about how companies like FedEx, Nike, and Chick-fil-A are using GIS to revolutionize their operations.
Another surprising story was the one about explosives, which turned out to have a gender equity narrative at its core. That caught me off guard, but it immediately grabbed my attention.
None of the chapters went exactly as I had planned, which made the process even more rewarding. With many of these stories, I had a general idea of what to expect, but I was always surprised in some way. And, of course, there were dead ends. In the introduction, I mention spending weeks on chapters only to realize I had to move on or risk getting stuck in a black hole. But that’s part of the writing process.
Were there any stories you researched but didn’t include in your final work?
I initially planned to write an entire chapter on the Census. After three weeks of reporting and conducting about 20 interviews, I realized the chapter would overwhelm me. So, I pivoted to focus on Deirdre Bishop and the geography division instead.
Another challenge arose with conservation. With 15 years of experience in that field, I was aware of many organizations utilizing GIS. Initially, I looked into the expected conservation stories, such as those from the Bureau of Land Management or USGS. They are all incredibly useful, but they didn’t connect to a larger narrative that I was looking for. Until someone at Esri mentioned conservation efforts in Africa, led by Africans.
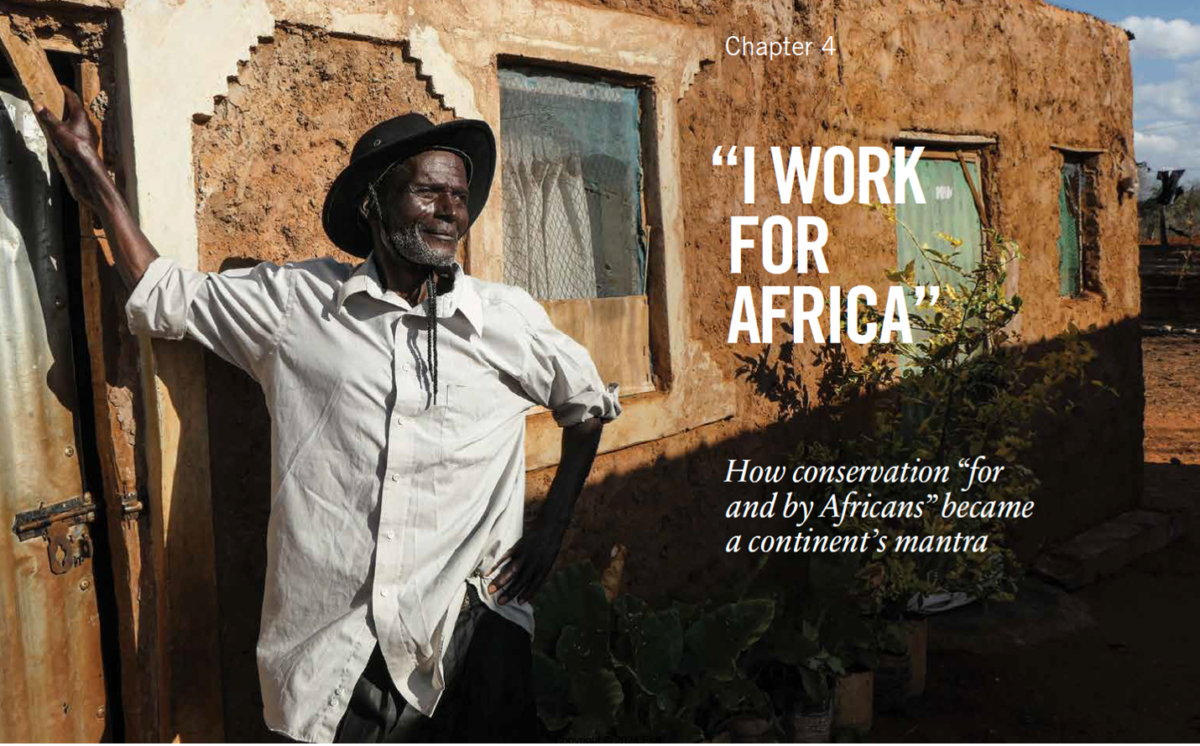
This was far more compelling than the American NGOs I knew about. I found stories of grassroots initiatives where local communities are empowered by GIS to manage their resources and preserve biodiversity. It connected to larger themes like colonialism and the tension between development and conservation. These narratives highlight the essential role of local agency in environmental stewardship. If we’re going to achieve our ‘30×30’ goals, we must get Africa right.
You’ve got incredible actors making real-world changes, but you’re also writing about the technology behind it. How did you manage to balance those elements?
I have plenty of notes on that! I remember a particularly exhausting day at the HALO Trust in Scotland for the explosives story, where I had about nine back-to-back meetings filled with technical jargon. What I really wanted to understand was Luan Jaupi’s personal experience – why housing refugees was so important to him. I was relentless in digging into personal stories, to get people to open up about the costs and benefits of their experiences.
While the technology is important and certainly gets its due, it’s the human experiences that truly engage readers in a general-interest book.
One of the most surprising aspects was how connections emerged between the technology and the stories. For example, the National Geospatial-Intelligence Agency [NGA] first made a public database during the Ebola crisis, and Survey123 was developed for that purpose. I have pictures in the book showing de-miners using Survey123 in Afghanistan and a cop in Berkeley using it in California. These connections threaded the chapters together, revealing how ubiquitous and universal the technology is.
Your book is filled with optimism about the potential of GIS to address some of the biggest challenges in the world. How did you balance this optimism with the more complex realities?
The optimism was influenced by the time I wrote it, but it’s also rooted in the power of visual storytelling. People who tackle problems genuinely believe they can make a difference, and maps, being visual tools, help facilitate that process. I’ve witnessed this repeatedly. The individuals I wrote about are problem solvers who have faith in their ability to effect change.
Of course, I’ve met individuals who feel trapped in bureaucracies, like a federal worker who approached me at a book signing to describe his job as a nightmare due to all the red tape. Yet even he believed he could make a difference if the system would allow it. The people featured in the book share that perseverance; they are driven by a belief in collaborative decision-making and problem-solving.
Ultimately, I think the book is relatable because it highlights qualities we all share – resilience, collaboration, and the desire to solve problems. If readers connect with those themes, I’d feel I’ve succeeded.
You mentioned visual storytelling. As a fellow journalist, I’m curious: with tools like Esri Story Maps and increased access to satellite imagery, how do you see visual storytelling evolving in journalism?
I believe it largely comes down to exposure. Once younger journalists experience the power of GIS-based tools and other visual storytelling methods, it truly clicks. For instance, there’s a journalist in California named Paulette Brown Hinds, whose group of newspapers serve predominantly Black communities. I thought about doing a chapter about her. They utilize GIS to report on these communities, making it a signature approach for their coverage.
We are already in a multimedia age, and that will only continue. Look at how major outlets like The New York Times and The Washington Post are employing visual storytelling; it’s far more engaging and effective than traditional text alone.
For me, visual storytelling has always been the most powerful form of communication. ‘Show don’t tell’ has been my guiding principle throughout. I hope this book would help journalists recognize the value of GIS in how it can be utilized as a tool for change while maintaining a focus on human stories.
Do you think visual storytelling, like maps, can effectively change mindset and shift people away from extreme viewpoints?
I believe visual storytelling, including maps, is typically more effective in areas like planning than in altering long-held political beliefs. For instance, in Bakersfield, the maps played a significant role in changing some minds, but more importantly, they empowered community leaders to engage with their communities by saying, “Here’s what we could do.”
Bakersfield stands out because, against all odds, they managed to get it right. It’s a deeply divided red city, yet they successfully redrew districts to enhance political power for people of color. The focus was on the maps, but it wasn’t just about the maps; it was the passionate individuals advocating for change behind them.
One last question: we can’t be discussing GIS these days without mentioning Tim Walz! If he gets elected, do you think GIS will become a common topic of conversation, similar to how people talk about satellites today?
If Tim Walz is elected, he’ll carry the hopes of countless GIS professionals on his shoulders. I believe he could significantly enhance the visibility of GIS. He’s already done so in Minnesota. He effectively uses these tools to communicate with both the public and government partners.
Read: Tim Walz: The ‘GIS nerd’ at the Heart of the 2024 US Election
With him in office, more people may begin to see maps as valuable conversational tools, potentially giving GIS the mainstream recognition it has historically lacked. Explaining GIS can be complex – it’s not as straightforward as satellites since everyone can see the satellites. However, with a leader like Walz, the visibility for GIS could reach unprecedented levels.
Where to get the book

Be the first to comment