
The Canadian Urban Environmental Health Research Consortium (CANUE) is a group dedicated to understanding urban living and its impacts on human health. They have created a new assessment tool, GoodScore.City, which looks at multiple factors to determine which neighbourhoods across Canada provide the healthiest environments for their inhabitants. Pulling from the Local Logic tool on Realtor.ca, while also considering the model set out by WalkScore, they wanted to create something that would provide a kind of score for different neighbourhoods. On top of some of the neighbourhood features included on Realtor.ca, they add an element to the application that included a “complex mix of environmental factors affects people’s health, like air pollution, noise, climate, in addition to walkability, access to transit, and having parks and community services nearby.“
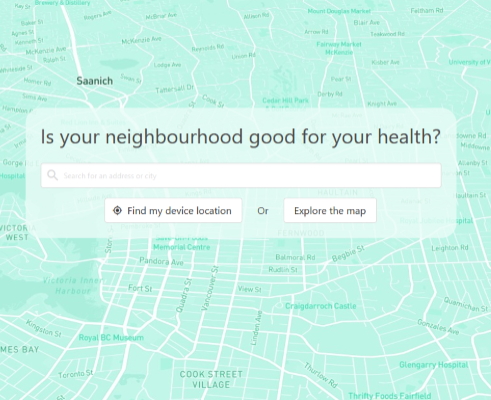
CANUE has developed a prototype tool aimed at increasing awareness of the built environment and the connections to health and climate change. GoodScore.City will be enhanced and expanded over the next three years, and new tools will be developed that show where neighbourhoods could be improved to increase environmental equity for all Canadians.
https://canue.ca/goodscore-city/
Factors and Weighting
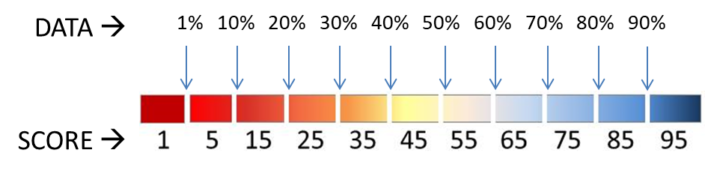
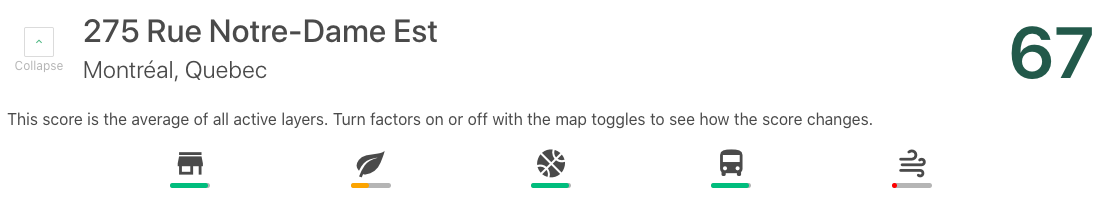
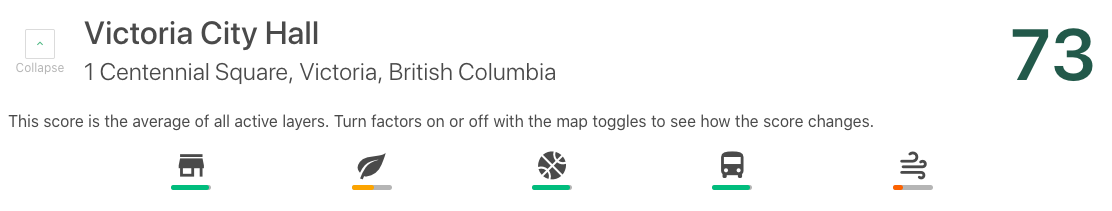
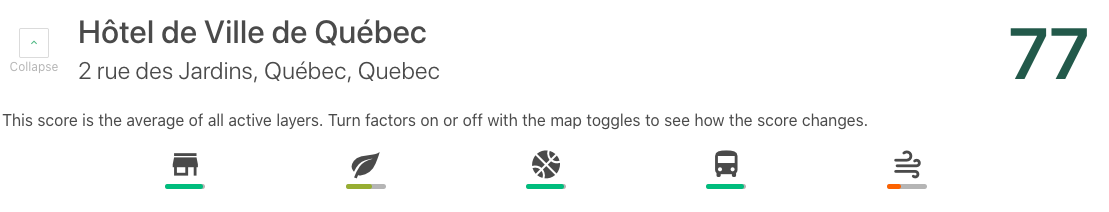
Looking at factors deemed to have the largest impacts and be most relevant to those living in urban areas, they have created a new prototype map identifying neighbourhoods that offer the highest standard of living based on these ‘green’ amenities. The application includes consideration of Local Amenities, Green Streets, Outdoor Recreation, Transit Options, and Air Quality. Each of the factors for a city is given a score based on how they compare to other communities across Canada.
Before we dive into the numbers, it will be important to understand how these factors are considered a little bit more:
Local Amenities
A score based on the number of available stores, shops, and recreation facilities within a 1 km radius of the location selected. This can include anything from coffee shops and restaurants to zoos and museums, book shops, florists and hardware stores. This factor is sometimes called land-use diversity and having access to all of these different amenities is something every city-dweller knows is preferred when looking for a new place to live.
Green Streets
Green streets are critical for healthy cities and in this case, have been derived through the combination of Open Street Map data and Landsat imagery, determining the total length of streets nearby that have on-street trees or green vegetation. New research is showing the incredible variety of benefits for residents whose streets are ‘green’. For a summary, check out this page from the EPA.

Outdoor Recreation
Parks and recreation rankings are similar to the Local Amenities category, again counting the number of sites within 1 km of the specified location available for outdoor recreation, such as parks, swimming pools, tennis courts, picnic sites, and more.
Transit Options
Having a wide variety of access points for local transit is very important to urban communities. As many people do not own cars in these areas, it is important to have many options when taking transit around the city. This category counts the number of sites such as bike parking, bus stations and stops, train stations and stops, and more within a 1km radius of a specified location.
Air Quality
Air quality is the final factor considered for the application and is based on estimated concentrations of nitrous dioxide for a given area. This pollutant is most commonly associated with exhaust from cars and other transport vehicles.
Ranking the Cities
I have chosen to use the locations of City Hall buildings for all of the cities to make it easier for comparison. It is also important to note that these chosen factors trend more heavily towards strong rankings for large urban environments and lower scores for suburban or rural regions.

So let’s get started, here are the environmental health ratings for 14 of Canada’s largest cities and provincial capitals.
14. Moncton, New Brunswick

13. St. John’s, Newfoundland and Labrador

12. Regina, Saskatchewan

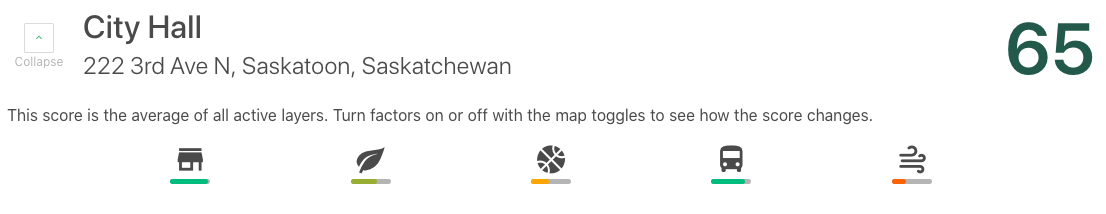
11. Saskatoon, Saskatchewan
10. Calgary, Alberta

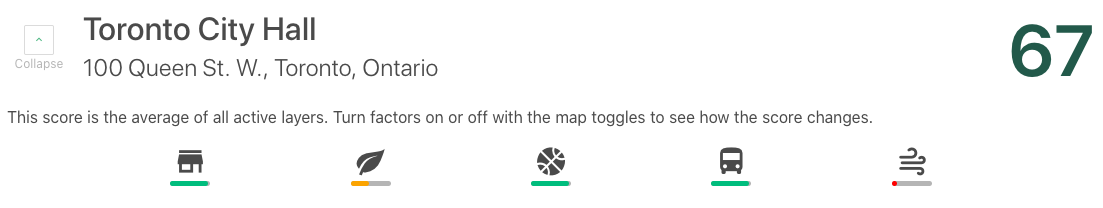
9. Toronto, Ontario
8. Montreal, Quebec
7. Edmonton, Alberta

6. Winnipeg, Manitoba

5. Victoria, British Columbia
4. Vancouver, British Columbia

3. Quebec City, Quebec
2. Ottawa, Ontario

1. Halifax, Nova Scotia

What is next for GoodScore.City?
The developers of GoodScore.City plan to add more factors and information as they continue to develop the product. They see this as a solution for cities to identify their most environmentally poor neighbourhoods. The app will also be a tool for urban planners and developers to create solutions to improve environmental health for citizens everywhere. They know that 90% of Canadians will live in urban environments by 2050 and how important it is we ensure these environments are as health positive as possible for all of the inhabitants.
I had an opportunity to speak with Allan Mckee, a communications specialist for CANUE working on the project, about how they got here and what comes next for GoodScore.City.
How did this project come together, and what do you hope to achieve with it?
Over the past five years, CANUE has generated and collated health-relevant standardized urban environmental exposure data for all locations in Canada and maintains a working data platform that disseminates these datasets free of charge to Canadian researchers. As a result, we have supported over a dozen world-class long-term health databases such as the CHILD study, Canadian Partnership for Tomorrow’s Health and the Canadian Longitudinal Study on Aging, as well as over 200 research projects examining the links between different aspects of the urban environment and population health.
Over the last year, there has been huge growth in the interest of Canadians to be outside, to go for a walk in the park or a bike ride not only to improve their physical health but increasingly to take care of their mental health as well. However, despite the deluge of research in this area, we wanted to see more awareness of the health effects of the built environment among Canadians. Having mapping tools that show exactly what features of our neighbourhoods promote better physical and mental health can really unlock these benefits for communities across the country.
With funding from the Public Health Agency of Canada, we are in the process of developing and refining this application so that Canadians can learn about environmental health, understand how their neighbourhood affects their well-being, and take action to improve their communities. We want this to be a tool that communities, advocacy groups, and urban planners can use to organize initiatives to make neighbourhoods healthier places to live.
What challenges did CANUE face in putting this application together?
The challenges are really around taking the massive amounts of data that we have available and condensing them into an application that’s useful, intuitive and relevant to people’s experiences. Part of that is deciding how the application is going to help visualize walkability or green space in a way that makes sense to most people. As we’ve tested it and gotten feedback on it, we’ve been refining the data to what’s most applicable in people’s daily lives. The next version of the tool, which will be called HealthyPlace.City will be ready for testing in early 2022, and we look forward to getting more feedback on that version.
How do you hope to improve GoodScore.City in the future?
When we launch the next version of the application in 2022, we will again be seeking feedback on the application and, specifically, the variables included in its datasets. We hope to engage a broad swath of Canadians because we want this application to be a tool for Canadians to start thinking about how where they live affects their health and to support them to organize their communities around health-promoting initiatives, whether that’s starting a community garden, advocating for more pedestrian routes, or organizing outdoor activities.
Who are the team members involved in this?
We’ve got a core team of two co-directors, a communications specialist, a geospatial specialist and a project administrator. They are supported by a research team that’s comprised of eight of the top scientists working on environmental health in Canada. We also benefit from the insights and recommendations of an advisory committee that has representation from public health, urban planning, and environmental science and gives us a holistic perspective on the applications we’re creating.
I know we are certainly excited about the release of the updated version of the application in early 2022. GoodScore.City and the upcoming HealthyDesign.City provide helpful insights not only for realtors and prospective homebuyers but also for governments looking to assess the overall environmental health of their municipalities and local neighbourhoods.


Be the first to comment