
-
Ukraine Interactive Map
-
Mapped: Carbon Dioxide Emissions Around the World
-
The Dawn of the Space Economy: The New Frontier in Geospatial Data and Climate Control
-
Geolocation data offers new insight on popular areas visited by locals, tourists
-
New and more detailed map of antimicrobial resistance
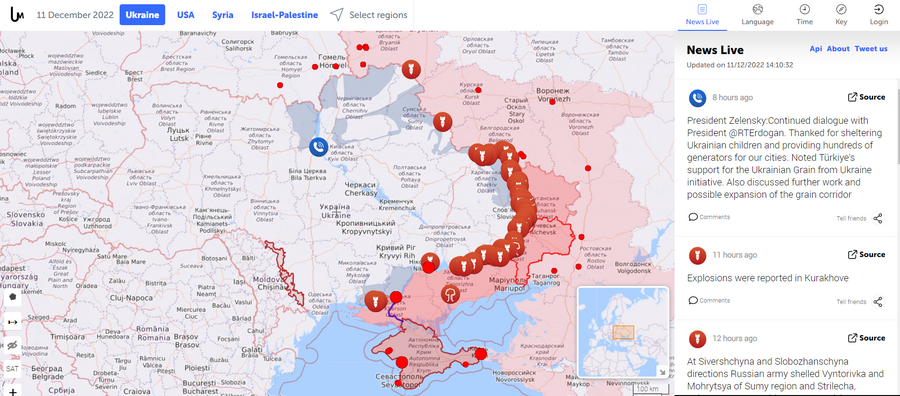
Ukraine Interactive Map
Ukraine Interactive map is a live map which displays areas within the country where there is reports of violence. Reports are plotted on the map and are described in more details on the right hand side of the screen under “News Live”. In addition to describing the incident, the user can view the source of the information to gather more details. Like most online interactive maps users have the ability to toggle on satellite maps, measure distance, draw polygons, etc. This is done in the bottom left hand side of the screen.
In addition the Live Map is available for areas such as Syria, Israel-Palestine, and the USA.
View the interactive map here.
Mapped: Carbon Dioxide Emissions Around the World
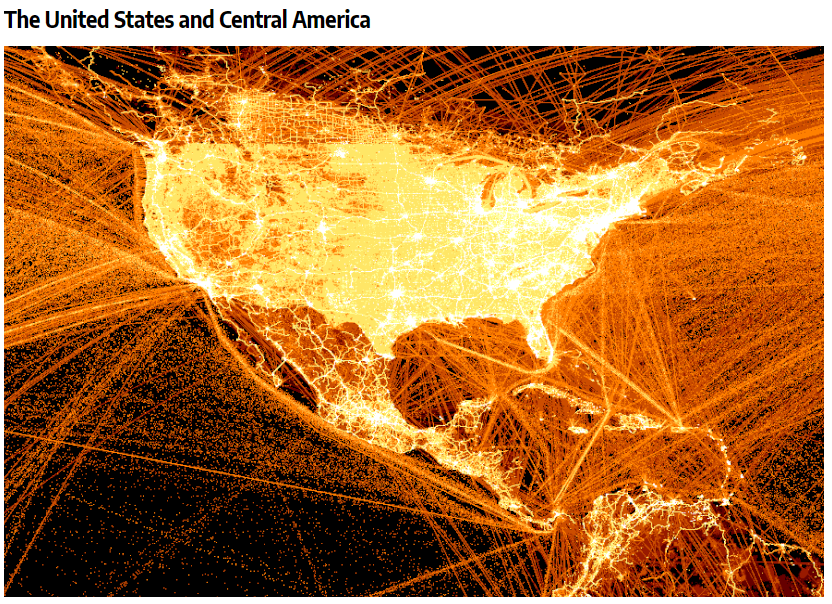
Using 2018 data collected by the European Commission that tracks tones of carbon dioxide per 11 square kilometer grid, Adam Symington was able to create this visual graph. Lighter colours like white indicate large amounts of carbon dioxide, while darker colours like black indicate small amounts. The figure above shows the United States and Central America. It is east to tell where large city centres are as well as seeing the amount of carbon dioxide generated by plans and container ships.
When viewing the larger map is becomes apparent where the most common and well used shipping lanes are, as well as flight routes. Further in 2018 the country that accounted for the largest amount of carbon dioxide emissions was China at 27%.
View full article here here.
The Dawn of the Space Economy: The New Frontier in Geospatial Data and Climate Control

Recently the Nasdaq inc. published an article detailing how space based geospatial data has/can/and will be used in climate control. “Of all the advances the space era has brought humanity, half a century later its pioneering benefits in geospatial data are more critical than ever. They have revolutionized solutions to address natural disasters, deforestation, climate change, and a host of other environmental imperatives.”
The article talks about current systems being used (like the Copernicus Sentinel 5P) and future ones in development (ESA second generation MetOp satellites) which are helping provide scientist and the general public with valuable geospatial data.
View full article here.
Geolocation data offers new insight on popular areas visited by locals, tourists
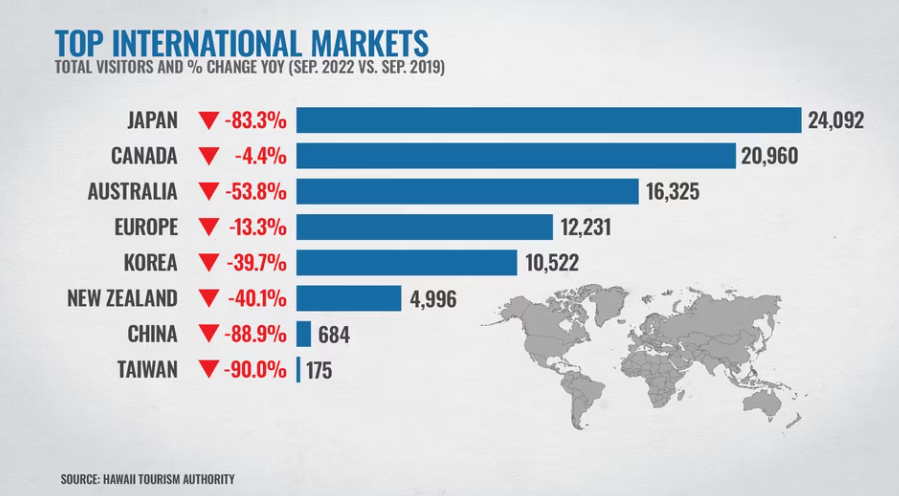
Recently Hawaii Tourism Authority has released new data on how tourism has change post-pandemic. They have used geolocation data from smartphone users to track which spots tourist frequent most as well as where they travelers are coming from. As you can see from the figure above, Hawaii’s international travelers have not reached it’s 2019 or pre-pandemic numbers. It is interesting to note that while international travel to Hawaii is down, domestic travel in 2022 has increased substantially from 2019 numbers. This has been attributed to recent hurricane damage in the Caribbean as well as more people with disposable income from working at home/not traveling during the pandemic.
Additional graphs and statistics can be found on the Hawaii Tourism Authority Symphony Dashboards.
View full article here.
New and more detailed map of antimicrobial resistance
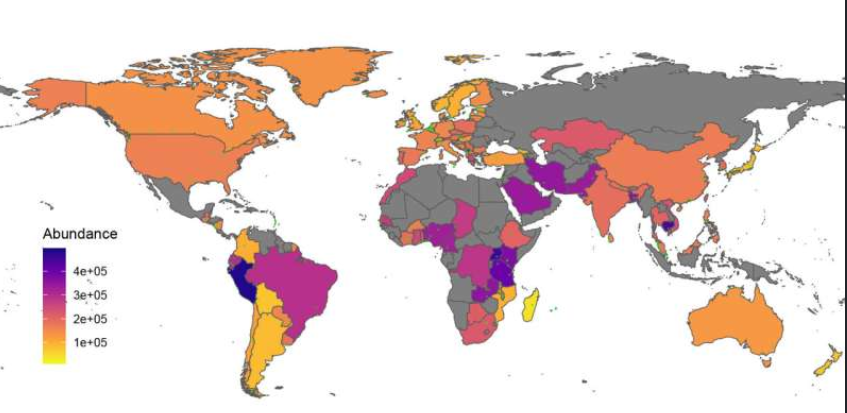
Since 2016 a group of researchers from DTU National Food Institute have analyzing sewage in order to monitor the development of disease in an area. This type of study has been in the news recently as countries have been using sewage to track Covid-19 variants in a region. Between 2016 to 2019 they analyzed samples from 243 cities across 101 countries (see below figure for results) an determined where the occurrence of resistance genes is the highest.
The successor to this project , global sewage project, is based on the findings from this study and it due to finish in 2023. The goal of both of these studies is to better monitor resistant bacteria and implement strategic policies.
View full article here.


Be the first to comment