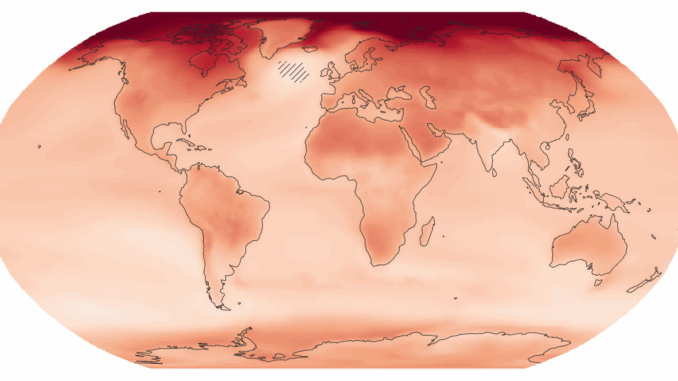
The latest Intergovernmental Panel on Climate Change (IPCC) sixth assessment report warns about the future of our planet under the impacts of climate change. Following the findings from the last report, measured in 2011, this sixth report illustrates that greenhouse gas concentrations continue to rise, and consequently global surface temperatures continue to rise. In fact, over the last 40 years, each decade has become consecutively warmer than any of the previous decades. According to the report and under each climate scenario, by the 2030s we will see a rise in global temperature of 1.5°C above pre-industrial levels, which will have devastating consequences to many of us around the globe.
What this means for Canada?
A CBC article posted last August discussed the many ways Canada will be impacted by climate change. The Arctic is experiencing twice the rate of warming compared to the rest of the world and being that much of Canada is in the Arctic we will continue to see an increased rate of warming in our northern communities. The arctic will experience extreme heat events that could continue to intensify and lengthen the wildfire season. Additionally, the thawing of permafrost can have extreme impacts on northern communities and can lead to the compromised structural integrity of buildings and transport systems. The melting of permafrost can also release methane, a greenhouse gas that can further contribute to climate change.
After the devastating heat wave, we saw here in Western Canada last June, heat events are unfortunately going to become a more common occurrence in Canada. Cities will also become much warmer under a warming climate due to the lack of large open green spaces and taller buildings absorbing more heat and preventing air circulation. Canada is also surrounded by nearly 250,000 km of coastline; this can make us extremely vulnerable to the impacts of rising sea levels.
The Interactive Atlas
The IPCC has created an interactive atlas that shows the impacts of climate change around the globe. This tool gives projections for temperature, precipitation, sea surface temperature and sea level rise and how these variables are projected to change under warming of 1.5°C, 2 °C, 3 °C or 4 °C compared to the baseline temperature.
Choose either the simple or advanced version, the simple version gives a great overview of the projected global impacts of climate change. Including everything from the simplified version, the advanced version gives you additional datasets to explore and allows you to change the period, scenario, and baseline for what the data is being compared to.

If you are interested in observing the change within Canada, the advanced version allows you to change the dataset to CORDEX North America, a more accurate model than the default when looking on a regional scale. Here you are able to see the time series change for a particular region.
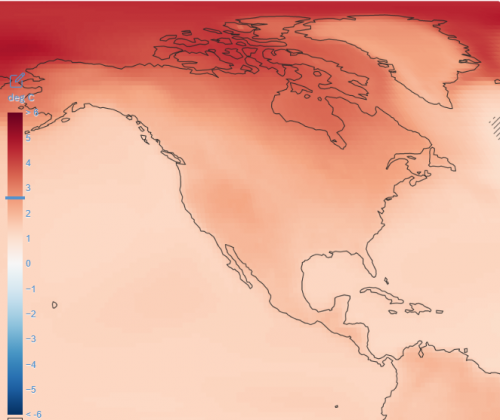
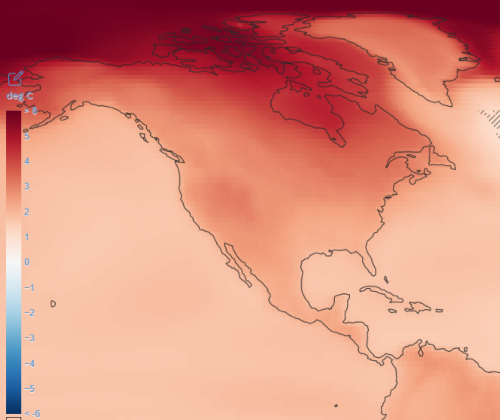
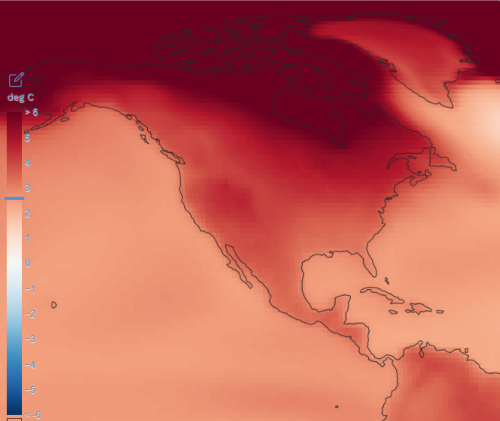
The above slideshow allows you to scroll through the mean temperature warming on an annual interval relative to 1850-1900 under the high emissions scenario SSP5-8.5, starting from an increase of 1.5°C and going to 2 °C then 3 °C and then 4 °C. An observation that can be made here is that the Arctic is warming at a much faster rate, it can also be observed that as the temperature rises closer to 3-4 °C compared to baseline temperature, the greatest change can be seen in the middle of Canada. For an increase in 4 °C, the majority of Canada sees a much larger change in temperature than the coastal United States.
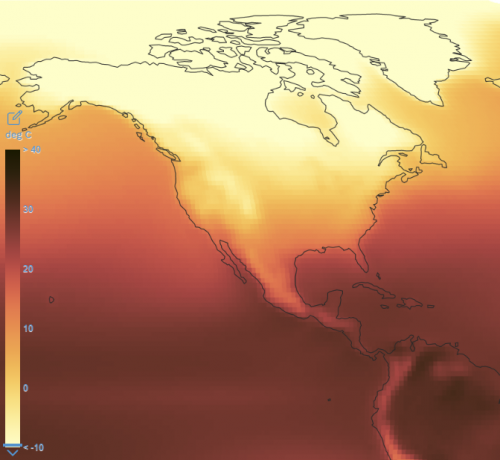

If we look at the degree Celsius value seasonally under the high emissions scenario SSP5-8.5, we see a much more grim reality of Canada’s future if warming reached 4 °C above pre-industrial levels.
The winter appears to be milder, with those close to the 49th parallel and near the coasts approaching that 10 degree Celsius mark as a mean temperature through the months of December to February. The summer paints a very grim picture for Canada’s future under a 4 °C warming relative to 1850-1900, as the mean temperature is pushing 30 degrees Celsius in many places of the country.
There is also a regional synthesis tool that when looking at the map, allows you to observe the different confidence levels by region to see if that region is projected to observe an increase or decrease in mean air temperature, extreme heat, mean precipitation, river flood, landslides, heavy precipitation, drought, fire weather, tropical cyclones, air pollution and more.

After going through the different variables of this atlas, some areas of concern for Canada are the medium to high confidence of increase in such weather events as extreme heat, heavy precipitation and pluvial flood, river flood, landslides, fire weather, tropical cyclones and avalanches. The data also found that cold spells, frost, snow, and permafrost all had high confidence of decrease.
The IPCC’s sixth assessment report warns of a disastrous future for our planet if we do not work on reducing our carbon emissions and strive to achieve net zero by 2050. This user-friendly interactive tool is great for displaying the sense of urgency to act now to mitigate the impacts of climate change. Also, it allows us to see the projected changes on a regional scale, so local governments can better prepare and adapt to a changing climate.
Further reading:
CBC: UN sounds alarm on ‘irreversible’ climate impacts, but offers hope
CBC: What the new UN report warning of climate impacts means for Canadians
Vox: Where extreme weather is getting even worse, in one map
IPCC: AR6 Climate Change 2021: The Physical Science Basis
IPCC: Climate Change 2021 The Physical Science Basis Summary for Policymakers




Be the first to comment