Back in 2006 I (Jim) was a student at BCIT and a Vancouver resident, eager to obtain some local data for a project. I sent a hopeful email to City of Vancouver (COV) requesting the data I needed.
The manager of the GIS branch sent me a timely reply, but solemnly informed me that the City did not give out its data for free. If I was interested, I could contact the appropriate department and make a purchase of the data. “Hmm, that doesn’t seem quite right. I’ve already paid for that data through my taxes” I thought– and I proceeded to digitize a rough facsimile of the data and Vancouver’s street network by hand, as many others had probably done before me.
The COV wasn’t alone in its approach to GIS data. Most governments kept the vast majority of their data locked up in closed repositories and outsiders could only obtain access if they had the right contacts and/or were able to pay substantial sums of money. At the time, I wasn’t aware of rapid and sweeping changes that were beginning to take place in access to (and attitudes about) government data.
Only a few years later, in 2009, the COV passed the Open3 motion, declaring that the City would “freely share the greatest amount of data possible while respecting privacy and safety concerns”.
The passage of this motion was part of a international trend towards more openness in government data. Simone Chignard, in his article “A brief history of Open Data” (2013/03/29 ParisTech Review) discusses the genesis and promulgation of some of the ideas that convinced leaders around the world to make government data more freely available. Chignard, echoing the ideas of Nobel Prize-winning economist Elinor Ostrom, points out that Open Data “are public goods of a new kind, their use doesn’t deplete the common stock, but it enriches it.”
Today, in 2015, we can see that there has been significant increase in availability of government data. It seems every hamlet, city, province/state, and country has their own Open Data site and is eager to give away information that was considered an expensive, closely-held asset. What a remarkable change in a few short years!
We now have an abundance of data offered up by many jurisdictions. But what can we do with all of these data? We need tools to be able to use these data and enrich our communities further by getting some value from them.
Fortunately the advance of Open Data GIS has kept pace with the increase in data availability. In the web sphere, Leaflet challenges the dominance of Google Maps. This Open Source (OS) JavaScript API doesn’t have all of the bells and whistle of Maps, but it still allows someone with minimal software skills to put features on a map.
In the desktop environment, QGIS has rocketed to prominence as a viable OS alternative to expensive GIS software. QGIS is free, is of high quality, and can do most of the display and analysis functions that the commercial GIS programs do.
As an example of how Open Source tools can mine the riches of Open Data, consider the following two websites:
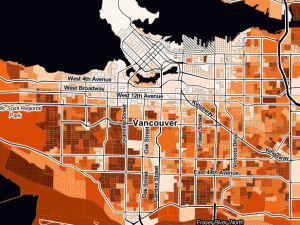
Each website uses the same underlying data sources, the 2011 Statistics Canada Census and open mapping data from the City of Vancouver. But the purposes and results of each website are completely different.
The Trick-or-Treat website estimates the amount of candy you should have on hand based on the number of residents who are 14 years of age or younger in a given location. A glance at Vancouver shows that the areas with the least amount of young people are on the north central part of Vancouver. Areas west and south in Vancouver have more young people.
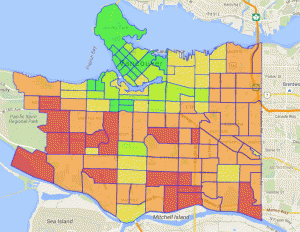
Vulnerable Vancouver’s purpose is to identify residents who would be especially vulnerable in the event of a disaster such as an earthquake.
Searching for the vulnerability factor “Population – 14 years and under” produces a map remarkable similar to the Trick-or-Treat map. And why not? They are both using the same data.
Each website uses Open Source tools to create its output. In the case of Trick-or-Treat, it is a Leaflet map. In the case of Vulnerable Vancouver it is a combination of Open Source software, including PostgreSQL, Python, QGIS, and PHP. Thus with the availability of both Open Data and Open Source software, one data source can be used for any number of purposes.
The Trick-or-Treat website has a humorous intent. Is it really important to map out the amount of Hallowe’en candy one should have on hand? Probably not, but it is innovative, and setting the preconditions for innovation is an important benefit of having freely available Open Data and Open Source software.
Imagine the past years when only large organizations could afford GIS software and when data were jealously guarded. Do you think that such an organization would have an employee spend time to produce a Trick-or-Treat map, or would be inclined to release such a map to the public? When the cost of GIS software is high and the data are private, only maps that help the organization turn a profit are likely to be produced. With Open Data and Open Source software, all of that has changed. Now the supply of data grows richer each year, and anyone can make a map.
The Geographic Information Systems program at Langara College marks the beginning of exciting new possibilities for GIS in B.C. We (Rick and Jim) are eager to see the many ways in which a creative user community of Langara-educated students can enrich us by putting Open Source GIS and Open Data to use.




Be the first to comment