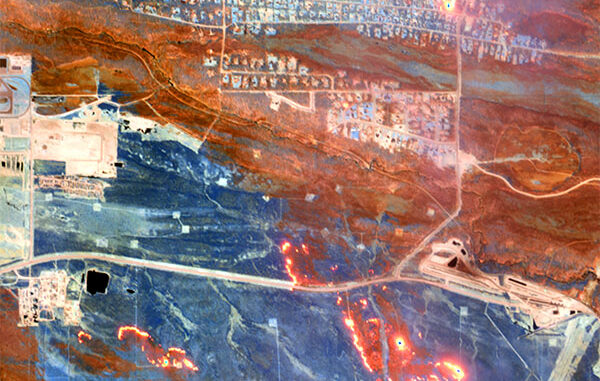
Images of the massive wildfire that engulfed Fort McMurray, Alberta earlier this year have been seared into our collective consciousness. Record-setting heat, low humidity, dry conditions and high winds combined to create a destructive “perfect storm” of fire weather the likes of which have been rarely seen anywhere in Canada – much less in an Alberta springtime.
As soon as the magnitude of the Fort McMurray inferno became apparent, the satellite imaging experts at DigitalGlobe began tracking the fire from space. Based in Westminster, Colorado, DigitalGlobe collected imagery around the clock to track and analyze the fire’s growth and quickly identify damage. Two of the unique tools used to track the fire’s spread was shortwave infrared imagery (SWIR) and visible and near-infrared imagery (VNIR). These technologies provided data scientists with a view through the smoke – enabling them to see what was actually happening on the ground.
Launched into Earth orbit in 2014, DigitalGlobe’s WorldView-3 satellite is the first commercial satellite to have eight high-resolution bands that capture information in the shortwave infrared regions of the electromagnetic spectrum (1195 nm – 2365 nm). When the eight SWIR bands are combined with the eight corresponding VNIR (400 nm – 954 nm), WorldView-3 can provide rich data for precisely identifying and characterizing man-made and natural materials, mapping the location of underground minerals, and other applications – like penetrating smoke.
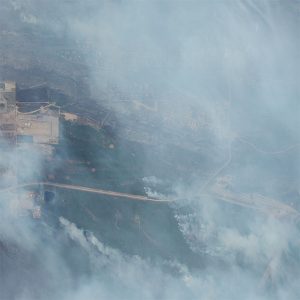
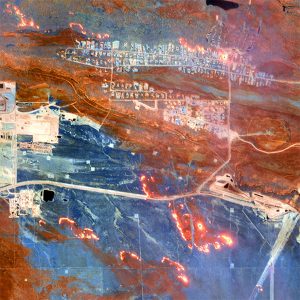
SWIR in particular gives fire managers a unique data set that enables visual interpretation and data analytics not available from any other high-resolution commercial imaging solution. When arranged in a false color composite, SWIR bands 6, 3 and 1 provide an image that penetrates smoke, shows active fire as orange, and provides a realistic view of the ground – as in the images below, where burned areas look brown and healthy forest has a blue-green color. In addition to the 631 combination, SWIR band 8 measures thermal data and can be used to identify active fires and hot spots.
RGB visible image
SWIR “631” image
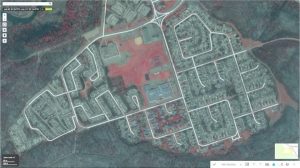
VNIR provides a very different (but no less important) view through the haze. In the before-and-after images from Fort McMurray below, VNIR-based imagery clearly differentiates between healthy vegetation (seen below in bright red) and dead or burnt vegetation (in dark colors). Lost structures are also clearly shown – to striking and terrifying effect.
VNIR image: Beacon Hill in Fort McMurray before the fire
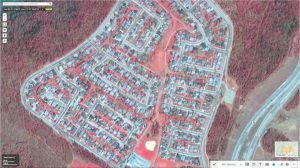
VNIR image: Beacon Hill in Fort McMurray after the fire
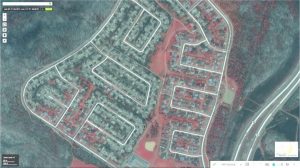
VNIR image: Hillview Park in Fort McMurray before the fire
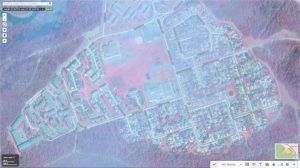
VNIR image: Hillview Park in Fort McMurray after the fire
The image analysts at DigitalGlobe passed their data along to decision-makers like first responders, relief workers and provincial governments. SWIR and VNIR images made a crucial difference in many ways, including actively identifying passable roads and impacted areas, as well as identifying the active footprint and burning hotspots to mitigate additional flare-ups and help suppress the wildfire.
Uncontrolled wildland fires have a devastating impact on communities and natural resources. Fast and effective detection is key to protecting infrastructure and ensuring communities’ safety. While it seems like fires should be easy to see, smoke typically obscures what the firefighters can actually see – both on the ground and from the air. Shortwave images penetrate the smoke show the firefighters exactly where the fire was, where it is and where it may be going – helping to protect valuable property, irreplaceable resources and, ultimately, the lives of residents and first responders.



Be the first to comment