International Geospatial Digest for June 24th, 2024
- Mapping Heatwaves from Space: How Extreme Temperatures Are Modeled
- Access 3D Maps in Maps JavaScript API starting today
- Environmental Twins Gain Traction in the Field
- US Geological Survey in Pasadena Announces Groundbreaking ShakeAlert System Upgrade
- NASA Is Using Powerful Satellites to Watch Over Endangered Species
- How a ‘Citizen Map’ Is Helping Brazil Prepare for Next Big Flood
Mapping Heatwaves from Space: How Extreme Temperatures Are Modeled
The article talks about the heatwave mapping tool called Goddard Earth Observing System (GEOS) model. The model utilizes data from NASA’s historical satellite missions and has a wide configuration of GEOS systems that uses predictive modeling for atmospheric conditions. By combining remote sensing tactics with heatwave models, we can predict heatwave trends, allow for proper authorities to prepare for these incidents, and help guide us toward a better understanding of climate change moving forward. Read more here
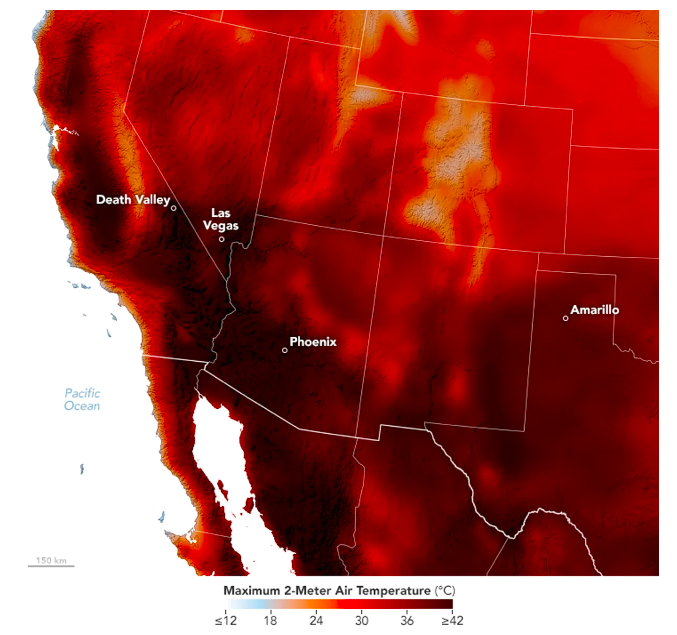
Map showing temperatures at 6.5 feet (2 meters) above the surface for the Southwest region of the United States between June 6-7, 2024. Map: NASA.
Access 3D Maps in Maps JavaScript API starting today
Maps JavaScript has such a wide array of industry use in today’s market. Navigation, food delivery, and research all utilize mapping to some degree. Because of this demand Photorealistic 3D Maps in the Maps JavaScript API is available for developers to use high quality 3D imagery for their mapping products. This advancement has made 3D rendering quick and efficient, providing users with a far more immersive and informative experience that 2D otherwise misses. The article continues in more detail about the experience both for the developer and user side. For a more digestible analysis, please refer to the second article provided. Read more here and here.
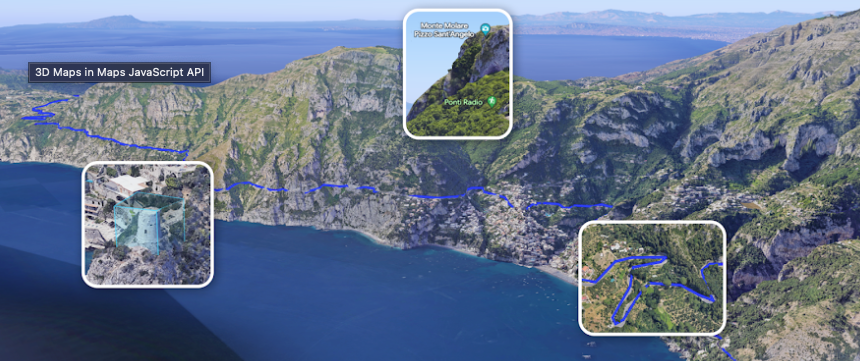
This post is part of our Google I/O 2024 series sharing the latest Google Maps Platform news from our annual developer conference.
Environmental Twins Gain Traction in the Field
The article focuses on digital twins, virtual replicas of physical assets, and their uses for more environmental related projects. Some of the examples of the applications of environmental related digital twins are hazard assessments for the effects of natural disasters like wildfires, mass wasting effects, and vegetation health. This digital twins application helps public and private clients better approach planning at different levels. Read more here
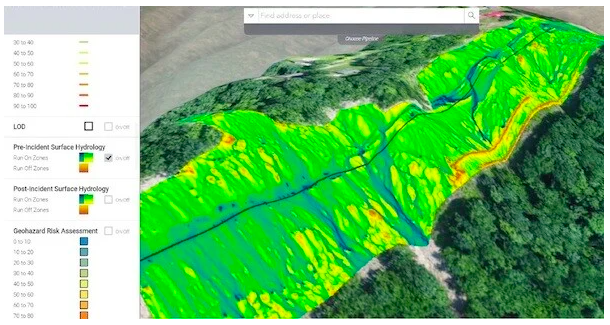
Huwa used aerial analytics and an environmental twin approach on a recent pipeline project to assess hydrology and potential hazards due to stormwater and erosion. Image source: Huwa. Click image to enlarge.
US Geological Survey in Pasadena Announces Groundbreaking ShakeAlert System Upgrade
Early earthquake detection methods are getting more robust thanks to the help of geomatics applications. A multi-stage detection system upgrade for the ShakeAlert System has been put in place by United States Geological Survey (USGS) team based in Pasadena. “In addition to seismic data, which tells us how fast the ground is moving, we are now adding information about how far the ground is moving up, down, forward and back.” The additional information can help early responders and residents and prepare earlier and more informed for the incoming danger from earthquakes. Read more details here
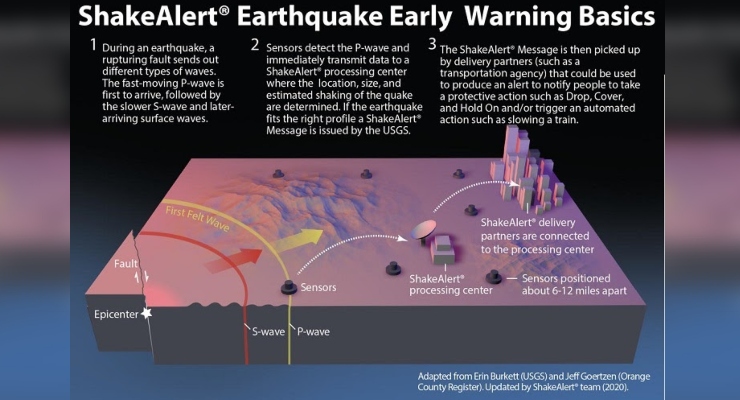
Upgrade to the ShakeAlert System showcasing the stage step by step process
NASA Is Using Powerful Satellites to Watch Over Endangered Species
NASA’s satellite data is helping ecologists protect endangered species across the world. Habitat loss for critical species, like elephants and tigers, is being monitored through infrared and spectroradiometer imaging. The imaging uses these imaging tactics to spatially quantify vegetation health. Read more here
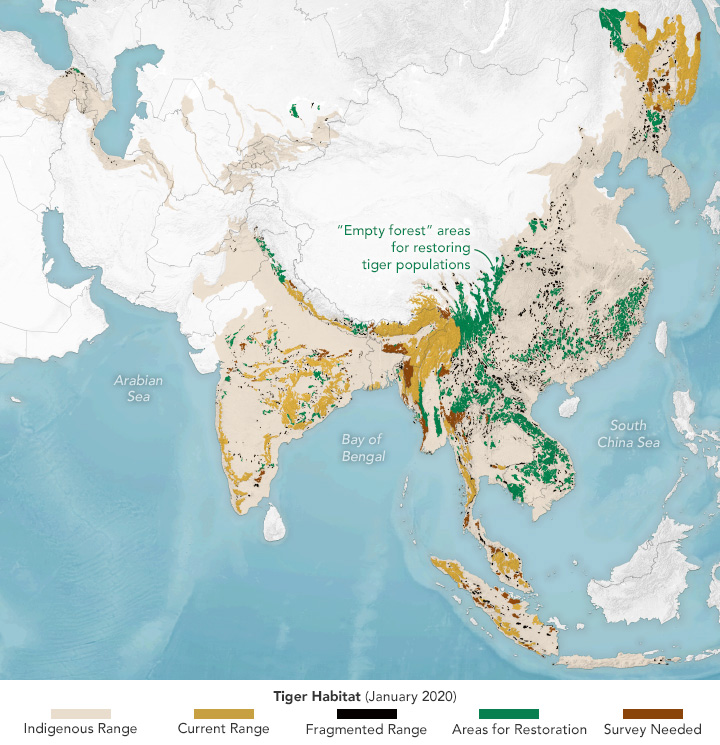
NASA Earth Observatory image showing tiger habitat in 2020. (Wanmei Liang using data from Sanderson et al., Front. Conserv. Sci., 2023).
How a ‘Citizen Map’ Is Helping Brazil Prepare for Next Big Flood
Southern Brazil faced some disastrous flooding in May this year. Residents are using community mapping tactics to document specific hazardous points. This tactic helps showcase the ease of access geomatics related technology as well as helps first responders quantify and assess the hazards before they arrive. Read more details here
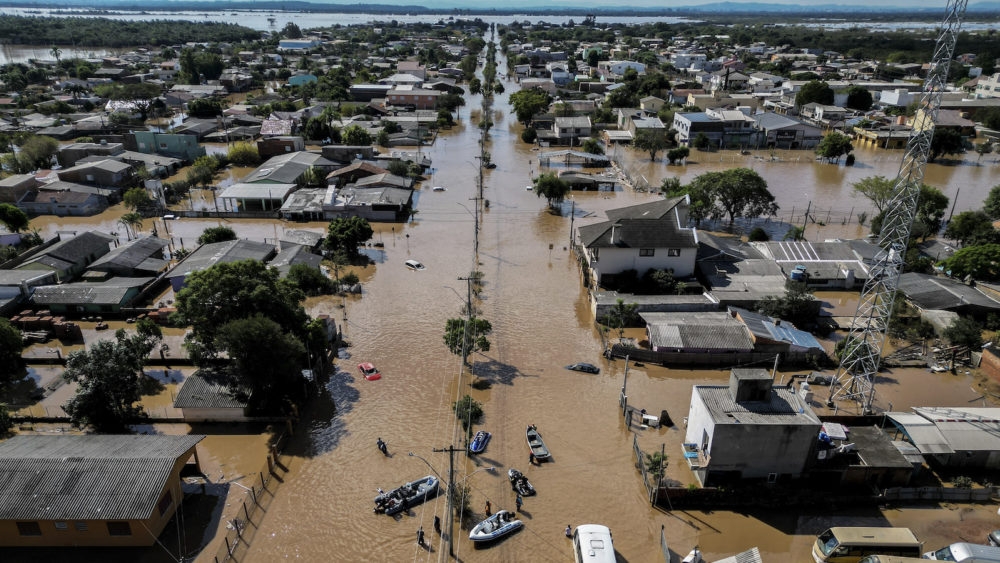
Flooding in Eldorado do Sul in southern Brazil, May 9, 2024. NELSON ALMEIDA / AFP VIA GETTY IMAGES


