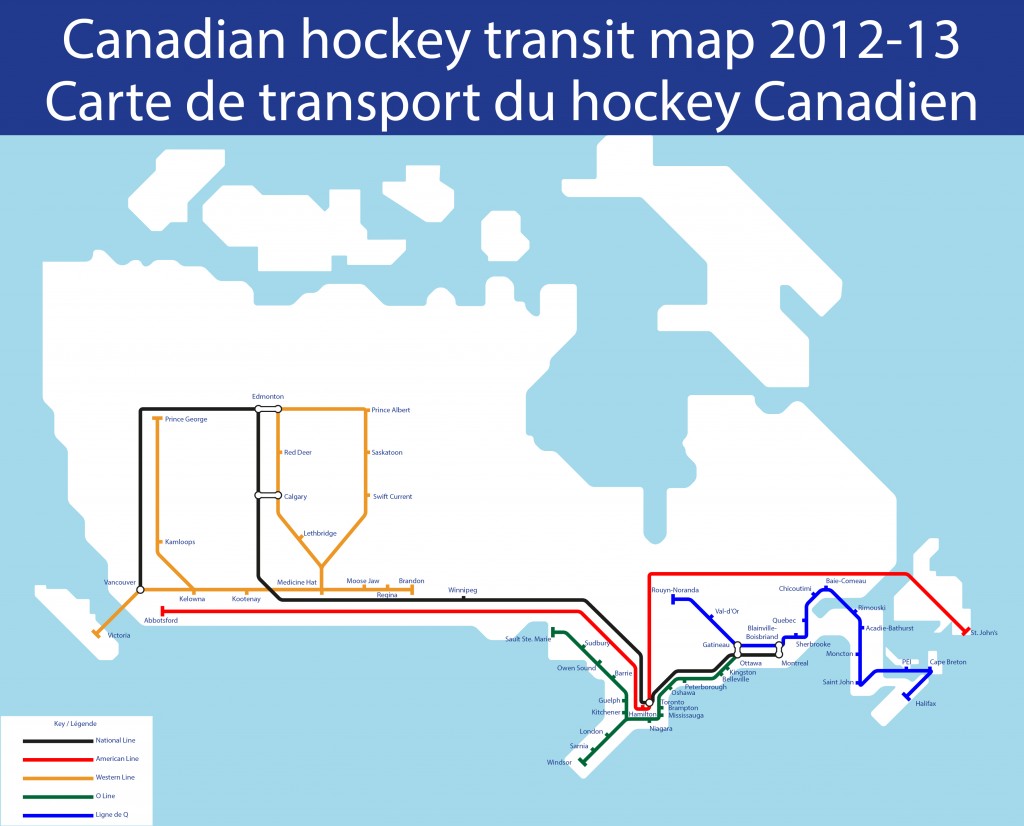
This time of year there is no shortage of magazines and web sites devoting space to articles on hockey. There are currently several season previews available that provide predictions on who will win the Stanley Cup, what teams have improved the most and what players are soon to be stars. However, few articles, if any, will include a geomatics slant. Everyone knows that hockey is an omnipresent part of Canada, ingrained in our culture, history, communities and media; but perhaps the geographical aspects of our national sport are overlooked. We have come to identify cities like Toronto and Montreal as the capitals of the sport, but surely smaller cities like Moose Jaw and St. John’s deserve to be recognized, too.
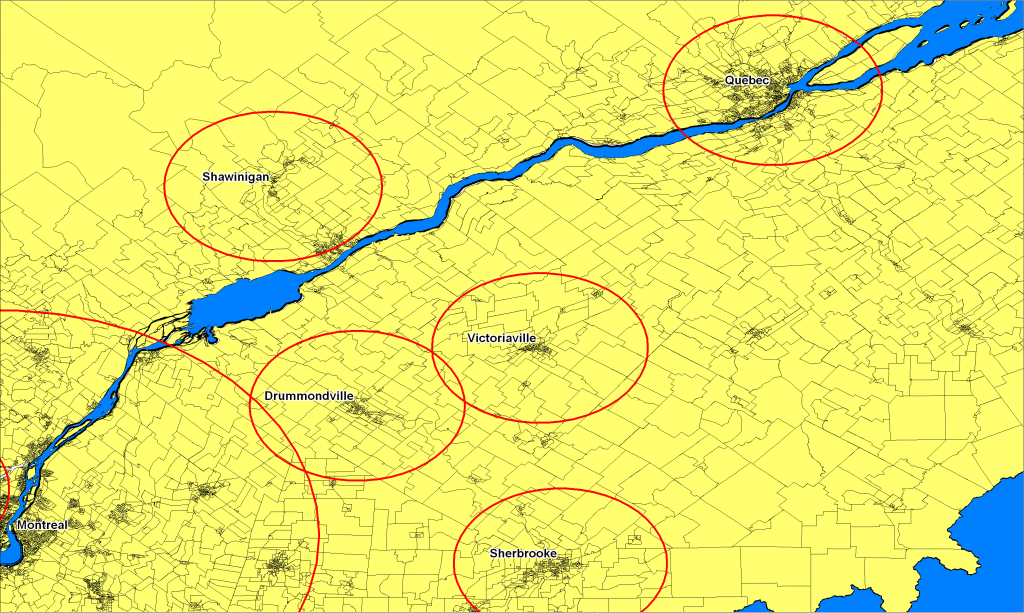
Every city and town in Canada has at least one team they can look at as the face of local hockey. Each team has its own territory, but the size of this territory can be hard to define for one team, let alone dozens. The National Hockey League gives each team a 50 mile (roughly 80 km) buffer, in which they can claim as their own and can keep free of other NHL teams. The next two most attended leagues in Canada, the American Hockey League and the Canadian Hockey League have similar territorial rights for each team, but fall far behind the NHL in quality of play, size of arenas, size of cities and costs. Given these factors, it’s fair for NHL teams to have a 75 km territory, while AHL and CHL teams have one a third the size at 25 km, as people are generally willing to travel much further for an NHL game. A 25 km buffer covers the entirety of cities such as Halifax, Quebec City and Victoria, so all residents in these cities, as well as some rural ones are included.
In all, 63 teams in the three leagues, representing every province, are being looked at. Within each team’s buffer, the population, based on the 2011 census, is used and compared to other numbers.
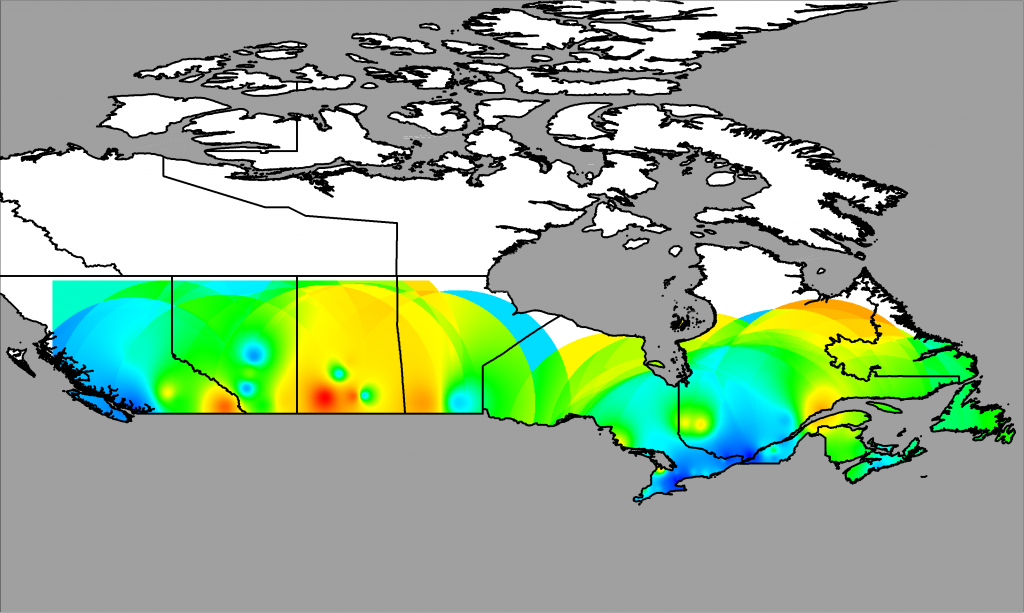
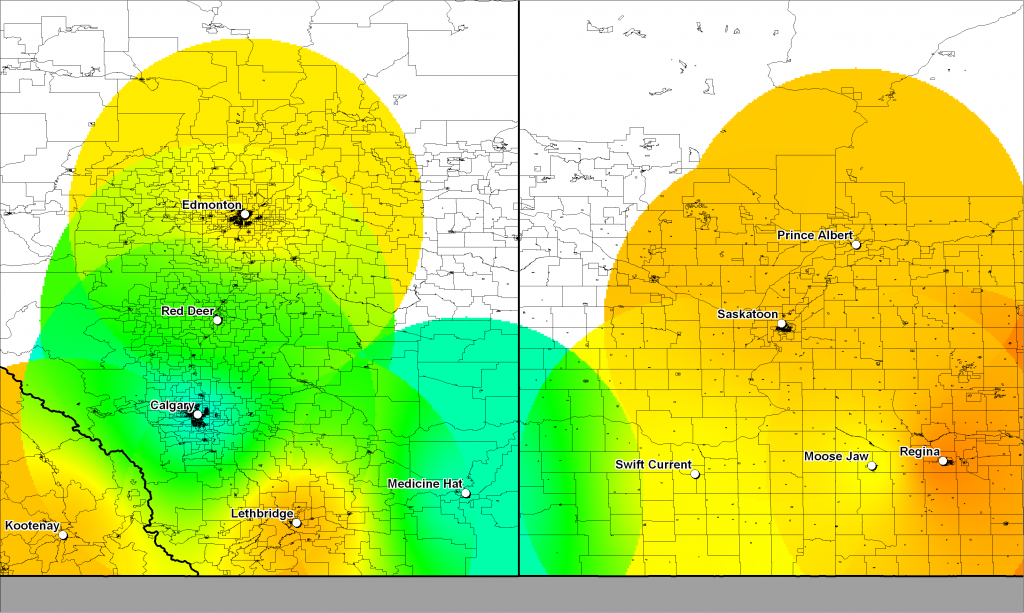
To determine an area’s zeal for hockey, two important factors to look at are how many people watch the sport and how many play. Neither factor has a statistic we can look at as an absolute determinant, but there are some basic ones that can tell us a lot. If we first look at how many people watch hockey, a team’s attendance will say a lot about the local interest in the club. Obviously, this number can be affected by how well the team is playing. To counter an unusual attendance number caused by an extraordinarily good or bad season, figures from the last three seasons are used, averaged and multiplied by how many regular season games each teams hosts per season. NHL teams host 41 games; AHL 38; the sub leagues of the CHL, the Ontario Hockey League and the Quebec Major Junior Hockey League host 34 games, while the Western Hockey league hosts 36. The NHL teams have the highest attendances, all averaging more than 15,000, but these are also the biggest cities in Canada. When we divide the total number of average fans per season by the population, we have the Real Fans number. One way to interpret this number is that it represents how many games the average person attends per season.
| Team | League | Real Fans |
| Swift Current | WHL | 4.39 |
| Moose Jaw | WHL | 3.39 |
| Kootenay | WHL | 3.34 |
| Brandon | WHL | 2.72 |
| Baie-Comeau | QMJHL | 2.66 |
Here we see the best and worst scores in each league.
| Team | League | Real Fans |
| Winnipeg Jets | WHL | 0.73 |
| St. John’s Ice Caps | AHL | 1.24 |
| Baie-Comeau Drakkar | QMJHL | 2.66 |
| Owen Sound Attack | OHL | 2.12 |
| Swift Current Broncos | WHL | 4.39 |
| Team | League | Real Fans |
| Toronto Maple Leafs | NHL | 0.11 |
| Toronto Marlies | AHL | 0.06 |
| Blainville-Boisbirand Armada | QMJHL | 0.05 |
| Brampton Battalion | OHL | 0.02 |
| Vancouver Giants | WHL | 0.14 |
The Toronto Maple Leafs and Montreal Canadiens who sell-out every game have some of the lowest Real Fans numbers with 0.11 and 0.19. The lowest Real Fans numbers come from smaller teams in the Toronto and Montreal areas. Despite playing the largest markets in the country, the Blainville-Boisbriand Armada have only 0.05 and the Brampton Battalion only score 0.02. Far and away, the best score goes to the Swift Current Broncos with. Swift Current has the smallest population of any team’s buffer with 17,832, but has the best Real Fans number by one over the next highest team the Moose Jaw Warriors, with 3.39.
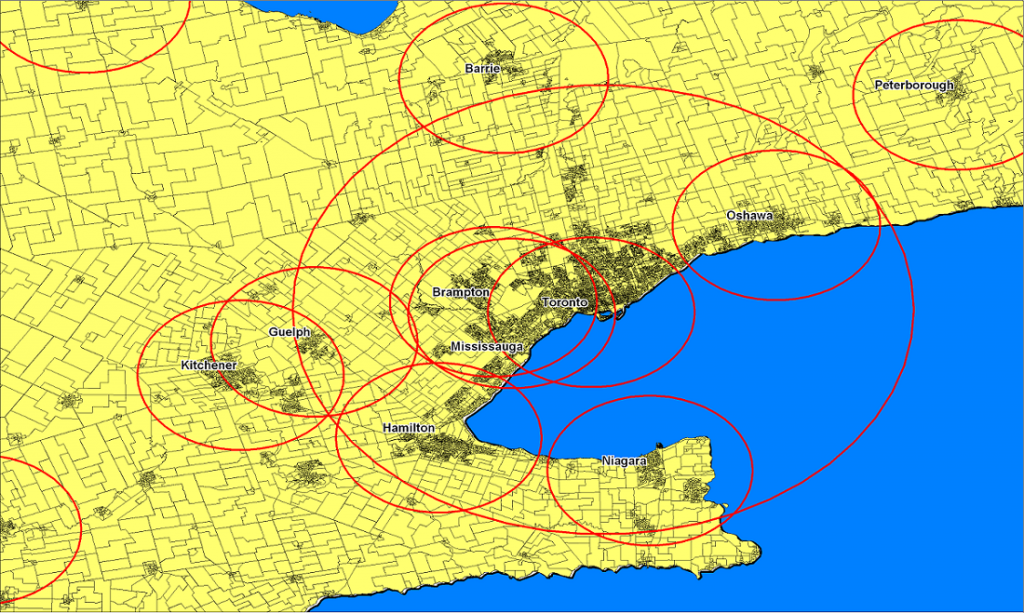
Aside from the Jets, every NHL team’s buffer intersects with at least one team from another league. In effect, these teams are competing with each other for fans, as many people live within the buffers of multiple teams. The Ottawa Senators buffer completely covers the buffers for the Ottawa 67s and the Gatineau Olympiques. The Toronto Maple Leafs buffer intersects the buffers of nine other teams in the area known as the Golden Horseshoe.
By combining these zones we get a fairer assessment of the hockey watching habits of each region.
| Region | Real Fans |
| Calgary | 0.85 |
| National Capital Region | 0.76 |
| Edmonton | 0.75 |
| Vancouver | 0.43 |
| Golden Horseshoe | 0.26 |
| Montreal | 0.23 |
Another way to measure a region’s passion for hockey is in how many people devote their lives to it. To measure this, we can use the players on NHL rosters going into training camp this year. Of that number, 1062 were born in Canada. 238 of these players were born in regions outside of the teams’ buffers, but the majority can be grouped with one of the regions previously looked at. By dividing the population by the players, we have a number that represents how many non-players there are for every player.
| Region | Players | People/ Player |
| Brandon | 7 | 7,687 |
| Regina | 21 | 9,591 |
| Charlottetown | 7 | 10,090 |
| Lethbridge | 8 | 12,944 |
| Baie-Comeau | 2 | 13.348 |
Only Kamloops and Chicoutimi currently have no players from their areas. Every other region has at least one player born there. Expanding the boundaries to provinces, Saskatchewan produces the most per capita, with one player for every 13,234, while New Brunswick is the least productive province with 60,314 people for every player.
Many conclusions can be drawn from these results. Smaller cities do appear to be more concentrated on hockey than the larger ones. Readers will surely think that big cities have more entertainment and athletic options than their counterparts, therefore fewer people are going to watch or play hockey. Toronto, Montreal and their suburbs have some of the worst Real Fans scores, but it would be difficult to accuse either of not being hockey cities. Baie-Comeau and Brandon stand out as being in the top five for both Real Fans and players produced. Prince Edward Island only has a few its natives playing professionally, but because the population is so small, this makes them only slightly less productive than Saskatchewan. The strongest part of Canada appears to stretch across Manitoba, Saskatchewan and Alberta as they score well in producing players and their teams are among the most attended in the NHL and CHL.
These numbers will no doubt continue to change. Almost every year, the team composition in Canada is made different through expansion and relocation. The Winnipeg Jets, St. John’s Ice Caps, Sherbrooke Phoenix, Blainville-Boisbriand Armada and Victoria Royals all had a smaller sample size for attendance because each is less than three years old. As this season begins, the Brampton Battalion have moved to North Bay and a Central Hockey League team has taken its place in Brampton. There is also the matter of teams and cities not covered by this analysis. Thunder Bay has no professional or major junior team, but has 13 players hailing from the Superior city. There are also many other senior and junior teams across the country who are the pride of their town. The Flin Flon Bombers, for instance, play in the Saskatchewan Junior Hockey League and have a Real Fans score of 2.71. Perhaps there are other zealous hockey regions we neglect.
Notes: The attendance figures are from the Internet Hockey Database hockeydb.com. The Winnipeg Jets, St. John’s Ice Caps, Sherbrooke Phoenix, Blainville-Boisbriand Armada and Victoria Capitals have each played less than three seasons, and their attendance statistics reflects such. The Mississauga Steelheads were formerly the Mississauga St. Michael’s Majors; and the PEI Rocket are now known as the Charlottetown Islanders.
| Team/Area |
Real Fans |
| Swift Current Broncos |
4.39 |
| Moose Jaw Warriors |
3.39 |
| Kootenay Ice |
3.34 |
| Brandon Wheat Kings |
2.72 |
| Baie-Comeau Drakkar |
2.66 |
| Rimouski Oceanic |
2.18 |
| Medicine Hat Tigers |
2.12 |
| Owen Sound Attack |
2.12 |
| Prince Albert Raiders |
2.05 |
| Val d’Or Foreurs |
1.88 |
| Sault Ste. Marie Greyhounds |
1.79 |
| Kamloops Blazers |
1.74 |
| Rouyn-Noranda Huskies |
1.73 |
| Acadie-Bathurst Titans |
1.61 |
| Red Deer Rebels |
1.39 |
| Saint John Sea Dogs |
1.31 |
| St. John’s IceCaps |
1.24 |
| Kelowna Rockets |
1.19 |
| Lethbridge Hurricanes |
1.17 |
| Sarnia Sting |
1.09 |
| Moncton Wildcats |
1.09 |
| Victoriaville Tigres |
1.08 |
| CapeBreton Screaming Eagles |
0.98 |
| Prince George Cougars |
0.91 |
| Drummondville Voltigeurs |
0.86 |
| PEI Rocket |
0.84 |
| Sudbury Wolves |
0.83 |
| Saskatoon Blades |
0.78 |
| Belleville Bulls |
0.78 |
| Shawinigan Cataractes |
0.76 |
| Regina Pats |
0.74 |
| Winnipeg Jets |
0.73 |
| London Knights |
0.69 |
| Peterborough Petes |
0.68 |
| Kingston Frontenacs |
0.67 |
| Windsor Spitfires |
0.65 |
| Halifax Mooseheads |
0.65 |
| Chicoutimi Sagueneens |
0.65 |
| Victoria Royals |
0.61 |
| Abbotsford Heat |
0.61 |
| Calgary Flames |
0.60 |
| Edmonton Oilers |
0.56 |
| Ottawa Senators |
0.54 |
| Quebec Remparts |
0.53 |
| SherbrookePhoenix |
0.53 |
| Barrie Colts |
0.48 |
| Kitchener Rangers |
0.35 |
| Calgary Hitmen |
0.29 |
| Niagara Ice Dogs |
0.29 |
| Vancouver Canucks |
0.28 |
| Oshawa Generals |
0.27 |
| Guelph Storm |
0.26 |
| Edmonton Oil Kings |
0.23 |
| Hamilton Bulldogs |
0.22 |
| Ottawa 67’s |
0.20 |
| Montreal Canadiens |
0.19 |
| Vancouver Giants |
0.14 |
| Toronto Maple Leafs |
0.11 |
| Gatineau Olympiques |
0.08 |
| Toronto Marlies |
0.06 |
| Blainville-Boisbriand Armada |
0.05 |
| Mississauga Steelheads |
0.03 |
| Brampton Battalion |
0.02 |
| Team/Area | People/Player |
| Brandon Wheat Kings |
7,687 |
| Regina Pats |
9,591 |
| PEI Rocket |
10,090 |
| Lethbridge Hurricanes |
12,944 |
| Baie-Comeau Drakkar |
13,348 |
| Saskatoon Blades |
13,801 |
| Kootenay Ice |
13,872 |
| Belleville Bulls |
13,991 |
| Prince Albert Raiders |
14,391 |
| London Knights |
15,185 |
| Edmonton Oil Kings |
15,323 |
| Edmonton Area |
17,332 |
| Edmonton Oilers |
17,332 |
| Swift Current Broncos |
17,832 |
| Moose Jaw Warriors |
18,345 |
| Prince George Cougars |
20,128 |
| Guelph Storm |
20,389 |
| Sault Ste. Marie Greyhounds |
20,454 |
| Victoriaville Tigres |
20,463 |
| Niagara Ice Dogs |
20,730 |
| Kingston Frontenacs |
21,323 |
| Windsor Spitfires |
23,979 |
| St. John’s IceCaps |
24,107 |
| Winnipeg Jets |
24,720 |
| Abbotsford Heat |
25,508 |
| Red Deer Rebels |
25,584 |
| Kitchener Rangers |
27,817 |
| Rimouski Oceanic |
28,448 |
| Gatineau Olympiques |
28,864 |
| Ottawa 67’s |
29,008 |
| Sudbury Wolves |
30,490 |
| Mississauga St. Michael’s Majors |
30,601 |
| Acadie-Bathurst Titans |
31,381 |
| Oshawa Generals |
31,513 |
| Golden Horseshoe |
31,806 |
| Toronto Maple Leafs |
32,082 |
| Halifax Mooseheads |
32,474 |
| Val d’Or Foreurs |
32,936 |
| Medicine Hat Tigers |
34,068 |
| National Capital Region |
34,172 |
| Ottawa Senators |
34,172 |
| Calgary Hitmen |
34,472 |
| Vancouver Giants |
34,619 |
| Toronto Marlies |
35,175 |
| Calgary Area |
35,695 |
| Calgary Flames |
35,695 |
| Victoria Royals |
35,706 |
| Barrie Colts |
36,559 |
| Vancouver Canucks |
36,827 |
| Hamilton Bulldogs |
37,025 |
| Rouyn-Noranda Huskies |
37,067 |
| Vancouver Area |
37,093 |
| Blainville-Boisbriand Armada |
39,384 |
| SherbrookePhoenix |
40,620 |
| Peterborough Petes |
43,129 |
| Owen Sound Attack |
46,145 |
| Montreal Canadiens |
46,380 |
| Montreal Area |
46,465 |
| Drummondville Voltigeurs |
52,033 |
| Brampton Battalion |
60,681 |
| Quebec Remparts |
62,133 |
| Moncton Wildcats |
69,199 |
| Shawinigan Cataractes |
73,521 |
| Kelowna Rockets |
88,575 |
| CapeBreton Screaming Eagles |
93,190 |
| Sarnia Sting |
101,370 |
| Saint John Sea Dogs |
112,735 |
| Kamloops Blazers |
N/A |
| Chicoutimi Sagueneens |
N/A |



Be the first to comment