Of all the pleasant events that happen in spring, crow attacks rank at the bottom of the pile. Crows become aggressive as the fledgling crows hatch, and attack anything that passes near the nest – humans, dogs, cats, squirrels, pigeons.
 This spring we (Rick and Jim) decided to tackle the crow problem with a little GIS. We created the CrowTrax map. This
interactive web map allows victims of crow attacks to report the details of the attack.

When the user clicks on the map at the location where the attack occurred, a form pops up and prompts the user to select the severity on a scale of 1 to 5 and then enter a report.
 When the user submits the form, their entry becomes one of a litany of reports about crows acting aggressively.
The CrowTrax web site hit a nerve with the public. Soon after its publication in April 2016, a flood of requests for interviews began. These interviews as well as second hand reports began appearing in major media outlets, including 24 Hours, CBC, Global News, Motherboard, Canadian Press, and CTV.
Despite this interest from the powerhouse media outlets, can you guess where the largest number of users got the link? From Facebook pages served up to their mobile devices. You can see a full list of media reports on the Media tab of the CrowTrax web site.
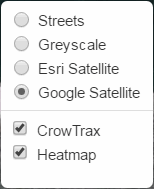 Under the hood, CrowTrax is composed entirely of free and Open Source software. To begin with, the map is a Leaflet map. Leaflet is an Open Source JavaScript mapping library that, unlike propriety mapping APIs, has no usage limits.
Like commercial mapping APIs, Leaflet contains features such as custom icons and heatmaps. It also provides a convenient layer control that allows the developer to display the layers right on the map without having to take up real estate in a sidebar. Leaflet can also retrieve tile layers from OpenStreetMap, ESRI, and Google.
On the back end, user input is stored in a Google Fusion Table. Fusion Tables are not Open Source, but they are free. The advantages of using Fusion Tables are twofold:
- You don’t have to store data on your own web server
- Google takes care of any security issues with the data
To get the user’s input to Fusion Tables, CrowTrax uses the jQuery JavaScript library and the PHP programming language. jQuery has become the de facto standard for JavaScript operations on web pages, with its API becoming almost as familiar as HTML to developers. PHP needs no introduction – 82% of web servers that have a server side program language use PHP ( source: W3Techs).
When jQuery sends the user’s input to the server side via an Ajax transaction, a PHP library developed by Google for accessing Fusion Tables receives the data and creates a record in the Fusion table. Fusion also has an SQL API so operations such as deleting spurious records can be done en masse.
Our purpose in creating CrowTrax was not only to do something about the crows, but also to publicize the Geographic Information Systems program that we teach at Langara College. CrowTrax after all, is a GIS. It asks questions that are spatial in nature. In this case, the questions are:
- Where are the crows?
- What are the crows doing?
Like CrowTrax itself, our program uses free and Open Source software such as QGIS, GRASS GIS, and Inkscape. With the advent of these high quality programs, GIS becomes available to everyone.
Our effort to publicize our program succeeded beyond our greatest expectations; registrations doubled within one week of the CrowTrax publicity. CrowTrax demonstrates the useful role that GIS can play in our world, and when you release the software so that everyone can participate, one can only imagine what GIS applications the next generation of GIS practitioners will create.





Be the first to comment