GoGeomatics has received an update from Pamela in Pakistan! She has returned safely to Canada and we are pleased to share a second installment of her work overseas. Continue reading to find out more about Pamela’s work in Pakistan.
GoGeomatics: Can you tell us about your work experience in while you were in Pakistan?
Pamela: While in Pakistan, I worked for the United Nations Office for the Coordination of Humanitarian Affairs (OCHA) at the country office in Islamabad. The office, located in a business complex housing other UN and humanitarian agencies, felt like many offices I have been in once I passed the metal detector, xray machine and armed guards. There are around 40 staff members in the OCHA office. Approximately three quarters of the staff are nationals and the remainder are from other regions of the world including Ireland, Kenya, Nepal, and Indonesia. The common language for communication is English and I enjoyed hearing Urdu being spoken around me. I joined the Information Management Team that included data analysts, a web master and four GIS staff (me included). I was recruited by CANADEM for a 3 month position in anticipation of increased need for GIS resources to support coordination of flood relief efforts in the provinces of Sindh and Balochistan. Information Management and GIS form one of the “pillars” of OCHA’s coordination activities. “The humanitarian community recognizes the importance of gathering reliable data on the locations of people in need, what they urgently need and who is best placed to assist them, and the value of this information for effective and timely humanitarian assistance. Geographic information is central to OCHA’s information management activities”. Quote from Craig Williams and John Marinos, UN OCHA Regional Office for Asia and the Pacific in their article in Directions Magazine.
GoGeomatics: What type of soft and hardware did you use?
Pamela: The software that we used in day to day operations was ArcGIS 9.3 and Microsoft Office Suite. The majority of staff worked on laptops, sometimes hooked up to external monitors. Laptops proved to be invaluable! When January rolled in, we were experiencing several power outages per day. The lights would go out and the power supply was out until backup kicked in. Everyday was an adventure! The GIS data was stored on a large central server and GIS staff were networked to several printers/scanners including an HP Plotter.
GoGeomatics: Did you learn any new skills?
Pamela: While I was in Islamabad, a staff person from OCHA New York provided Infographics training to staff from OCHA and other humanitarian organizations. An infographic (or information graphic) is a visual representation of information. The software we were trained with about infographics was Adobe Illustrator.
GoGeomatics: What type of data did you work with?
Pamela: Part of OCHA’s mission is to promote preparedness and at the heart of that is having key spatial datasets. During the floods of 2010 the GIS community pulled together to develop and share datasets. There was a big push in 2010 to digitize the administration boundaries at the Tehsil, Union Council and Mauza levels which are in progressively more detail below the country, province and district levels. The administrative boundaries of Pakistan are divided as per the image below:The GIS community pulled together to support Population Census Organization of Pakistan (PCO) in this task and succeeded in completing mapping for the flood affected areas. Work on updating the rest of the country is continuing.
GoGeomatics: What other type of data did you work with?
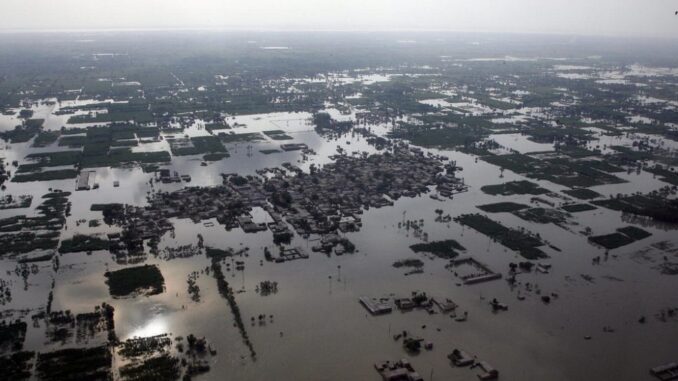
Pamela: In any emergency OCHA information management officers work with partners to produce standard information products to support coordination of all the humanitarian organizations and the response operation. Prior to my arrival in Pakistan surveys had been done to assess the extent of the damage caused by flooding. Information Management staff at OCHA and other agencies processed the data and the GIS staff subsequently used it to prepare maps. Click on the link to view a map produced by the OCHA of flooding in Pakistan. The United Nations Institute for Training and Research’s (UNITAR) operational satellite applications programme (UNOSAT) provided some assessment of the extent of flooding.
One of OCHA’s key data products is the 3W database detailing who is doing what where. This database is continuously updated via a form that is either e-mailed out or downloaded from the PakResponse website. Completed forms are returned to OCHA for collating and cleaning. The data is then given to the GIS staff for mapping and creation of various infographics.
Maps on the extent of flooding based on satellite image analysis were provided by the Food and Agriculture Organization of the United Nations. This organization has a close working relationship with the National Space Agency of Pakistan (SUPARCO). Additional information on flood extents was provided by the United Nations Institute for Training and Research. Click to view comparison maps of flooding in pakistan and click on the “view image comparison” tab and this neat little bit of technology lets you compare images of the Indus River flats from January 2012 images of the same area from January 2010 simply by moving the bar across the image.
Pamela returned safely to Canada at the end of February. We want to thank you Pamela for sharing your work in detail about flood mapping in Pakistan! We wish you every success back in Canada and hearing about your future endeavors.


Be the first to comment