The summer of 2017 marked one of the worst fire seasons in British Columbia’s history. By October, wildfires had covered approximately 1.2 million hectares, prompting the province to spend $649 million in fire suppression costs alone (Province of British Columbia, 2020). The purpose of this experiment is to evaluate the effects of wildfires on local landscape metrics and analyze the characteristics of land cover change across the post-fire landscape.
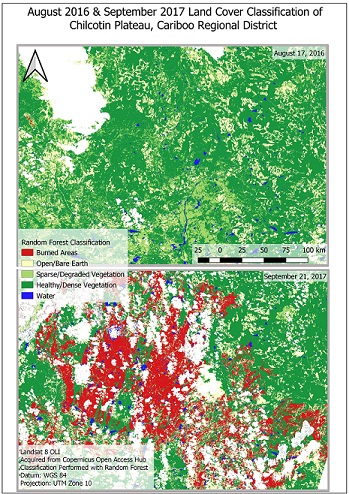
The 700,000 ha study area is situated southwest of Quesnel, centered on the Chilcotin Plateau fire complex which merged in July. The area is diverse in terrain and ecosystems, though coniferous forests prevail with a mixture of fir, pine, spruce, and aspen meadows (Trail Ventures BC, 2020). The southern half of the study area lies within the Williams Lake TSA (Timber Supply Area), lying between the Coast Mountains in the west and the Cariboo Mountains to the east. The northern half covers part of the Quesnel TSA. The area is a valuable source of lumber; 3 million cubic metres are cut annually (2020). The study area also contains Nazko Lake Park, While Pelican Park, and the Narcosli Lake Ecological Reserve. To the east are the communities of Williams Lake and Quesnel.
Two Landsat 8 OLI images from August 2016 and September 2017 were acquired from USGS for the primary analysis. Auxiliary data describing historical fires, logging areas, and land cover from DataBC provided background information. Aerial images from Google Earth provided some rudimentary ground truth data. Much of the geoprocessing was performed in a QGIS environment, though the classification and accuracy assessment were accomplished using RandomForest and caret (Classification and Regression Training). Landscape metrics were computed with FRAGSTATS, and a transition matrix was created using MOLUSCE (Modules for Land Use Change Simulations).
Bands 2 to 7 from each image were stacked and clipped to the study area. Top-of-atmosphere radiometric values were calibrated and corrected for sun elevation. Clouds and shadows were masked out, and training sites created. Bare Soil Index (BSI), Normalized Difference Vegetation Index (NDVI) and difference Normalized Burn Ratio (dNBR) were calculated to refine classification training sites according to thresholds set through research and ground-truth data.
Classification was divided into four broad land cover categories. ‘Burned Areas’ encompasses areas directly affected by fires with no vegetative regrowth. Open/Bare Earth represents areas covered mostly by soil, rocks, and trace amounts of vegetation. Sparse/Degraded Vegetation represents unproductive grasslands and sparse, degraded forests. Healthy/Productive Vegetation delineates areas of dense forests, productive fields, and thick foliage.
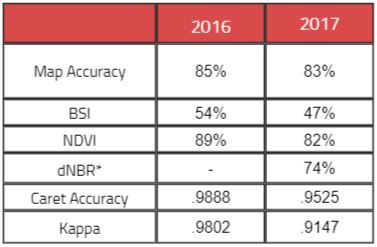
The landscape was modeled through Random Forest and accuracy was assessed using caret. Random Forest uses many decision trees to predict classes based on a set of data (Yiu, 2019). Functions within caret partition data, train models and evaluate model performance using a confusion matrix. Testing points throughout the classification maps are compared to aerial imagery acquired to assess map accuracy.
FRAGSTATS provided a landscape metrics system to evaluate ecosystem degradation and habitat suitability. It was founded on the notion that the patterning of landscape elements (patches) strongly influences ecological processes (McGarigal & Marks, 1994). Three metrics were chosen and normalized to analyze the broad pattern of change in vegetation classes as a result of the 2017 wildfire. By analyzing the patch shape, core area, and mean distance between patches, researchers can gain a broad interpretation of remaining ecosystem habitability and gauge the potential disturbance to local species.
MOLUSCE quantified land cover changes and transition characteristics between different time periods, revealing patterns of fire expansion. The software produces a change map which indicates the location of area changes. Shifts in landcover are recorded in a transition matrix, displaying the total proportions of each class and their direction of transformation.
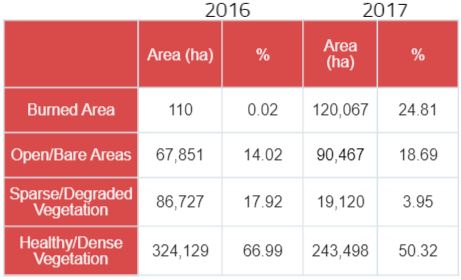
Approximately 120,000 ha experienced moderate to severe burning, and areas with healthy or dense vegetation decreased by 80,000 ha. Sparse/Degraded Vegetation zones also decreased by approximately 66,000 ha. Overall, the region has experienced significant losses in valuable forest resources and biomass-producing areas.
Healthy/Dense Vegetation was the largest contributor to Burned Areas; 21.9% of the class area was converted to the burned class. Sparse/Degraded Vegetation also contributed 34.3% of its initial expanse to Burned Areas. Approximately half of Open/Bare Areas remained unchanged, though a significant portion (27.8%) was converted to Burned Areas. Although the area remains dominated by areas represented by the Healthy/Dense Vegetation class, it will take decades for the area to reach pre-fire levels of biomass production.
The study shows that heavily vegetated areas bore the brunt of the damage from the fire outbreak, and the extent of fire-affected areas roughly coincides with independent data. There is significant damage to TSA areas as well as provincial parks. As a result, the remaining productive vegetation areas have become more complex, fragmented, and isolated. These broad changes potentially further stress local wildlife and inhibit recovery rates, as well as introducing additional access challenges for logging entities operating in the area.
The research methods performed moderately well at discerning basic differences in broad classes. Map accuracy and index correlation were relatively successful as well. The Random Forest model also reliably predicted the correct classes based on spectral signatures. However, the study has some significant shortcomings. Individual indices were not sufficient in predicting land cover: although stacking them improved results, class spectral signatures proved to be more complex and varying than limited thresholds of several bands. The Landsat data was unable to produce meaningful distinctions in land cover which could provide valuable information to stakeholders. Furthermore, Landsat data is limited by cloud cover; 27% of the September 2017 image was discarded to account for clouds and shadows, while the August 2016 set suffered about 20%. While map accuracy was high, ground-truth data was limited to aerial imagery available through Google Earth: the inclusion of surveys or LiDAR data would provide a more reliable method of obtaining true map accuracy. Overall, the study is a useful first step in evaluating damages inflicted on forest resources in a wildfire scenario and showcases how private and public stakeholders can quickly calculate and present these changes using open-source software.
Bibliography
Buma, Brian. “Evaluating the Utility and Seasonality of NDVI Values for Assessing Post-disturbance Recovery in a Subalpine Forest.” Environmental Monitoring and Assessment, vol. 184, 27 July 2011, pp. 3849-3860. Springer Science Business Media, doi:10.1007/s10661-011-2228-y
Diek, Sanne et al. “Barest Pixel Composite for Agricultural Areas Using Landsat Time Series.” Remote Sensing, vol. 190, 27 September 2017. University of Zurich, doi.org/10.3390/rs9121245
GIS and Earth Observation University. “Remote Sensing Satellite Data and Spectral Indices..” Spectral Indices with Multispectral Satellite Data, 2020, www.geo.university/pages/spectral-indices-with-multispectral-satellite-data. Accessed 22 May 2020.
Harper, Karen A. “Edge Influence on Forest Structure and Composition in Fragmented Landscapes.” Conservation Biology, vol. 19, June 2005, pp. 768-782, harvardforest1.fas.harvard.edu/sites/harvardforest.fas.harvard.edu/files/publications/pdfs/Harper_ConservationBio_2005.pdf. Accessed 25 May 2020.
Hennenberg, Klaus. “Core Area Analysis at Semi-Deciduous Forest Islands in the Comoe National Park, NE Ivory Coast.” Biodiversity & Conservation, vol. 17, October 2008, pp. 2787-2797, insights.ovid.com/biodiversity-conservation/biodc/2008/17/110/core-area-analysis-semi-deciduous-forest-islands/15/00008892. Accessed 23 May 2020.
Kuhn, Max. “Building Predictive Models in R Using the caret Package.” Journal of Statistical Software, vol. 28, November 2008, pp. 2-27. Foundation for Open Access Statistics, doi: 10.18637/jss.v028.i05
McGarigal, Kevin and Marks, Barbara J. “FRAGSTATS: Spatial Pattern Analysis Program for Quantifying Landscape Structure.: Oregon State University, vol. 2, March 1994. www.umass.edu/landeco/pubs/mcgarigal.marks.1995.pdf
Province of British Columbia. “Wildfire Season Summary.” Wildfire History, 2020, www2.gov.bc.ca/gov/content/safety/wildfire-status/about-bcws/wildfire-history/wildfire-season-summary. Accessed 9 May 2020.
Trail Ventures BC. “Flora & Fauna of the Southern Chilcotin Mountains.” Southern Chilcotin Flora & Fauna, 2020, trailventuresbc.com/southern-chilcotin-flora-and-fauna/. Accessed 9 May 2020.
United Nations Office for Outer Space Affairs. “Normalized Burn Ratio.” Space-based Information for Disaster Management and Emergency Response, 2020, un-spider.org/advisory-support/recommended-practices/recommended-practice-burn-severity/in-detail/normalized-burn-ratio. Accessed 30 May 2020.
Wu, Zhuoting et al. “Vegetation Burn Sevrity Mapping Using Landsat 8 and WorldView 2.” Photogrammetric Engineering and Remote Sensing, February 2015, pp. 143-156. Research Gate, doi: 10.14358/PERS.81.2.143
Yiu, Tony. “Understanding Random Forest”. How the Algorithm Works and Why it is so Effective, 12 June 2019, towardsdatascience.com/understanding-random-forest-58381e0602d2. Accessed 22 May 2020.
Yusryzal, Wan & Ibrahim, Wan. “Spatiotemporal Land Use Change Analysis Using Open-source GIS and Web Based Application.”International Conference on Urban and Regional Planning, May 2015, ResearchGate. doi: 10.11113/ijbes.v2.n2.64


Be the first to comment