One of the passions of modern day information technologists is to convert the past to digital form and to put it on display. To this end the City of Vancouver recently completed a large project to digitize a large portion of its holdings.
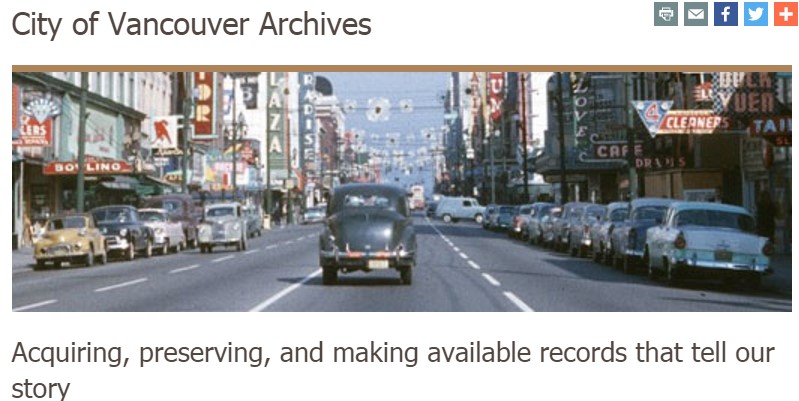
The result includes 250,000 records from the old management database, 74,000 photographs, and most importantly for GIS enthusiast, 4,000 maps dating from the late 1700s to the present day.
What can you do with a scanned map from 1877? How about georeference it to a modern day Google map? You will then get a unique comparison of the past with the present and gain insights into the future.
Georeferencing is the technique of taking a digital artifact such as a scanned map and matching it to a current digital map. This is done through the creation of control points.
If the user has survey points on the ground that the map also contains, they can put these points on the photo or map to represent “true” coordinates on the map and then stretch the map using the control points. In lieu of such precise survey data, the user can simply use a background map such as Google or Bing and match points that way.
Of course, it takes GIS software to perform all of these marvellous operations. You could purchase a proprietary product from a commercial GIS software vendor, but why go to the expense when equivalent functionality is available via Free and Open Source GIS software?
QGIS, available at http://www.qgis.org, offers the Georeferencer GDAL tool, which wraps the Geospatial Data Abstraction Library (GDAL) for its functionality. To use it, simply open QGIS and select Raster->Georeferencer.
The Georeferencer dialog, shown in Figure 1, has two panes, one for the scanned map and one for the control points. Our example uses a scanned map downloaded (for free) from the City of Vancouver Archives entitled “Map of Portion New Westminster District 1877”.
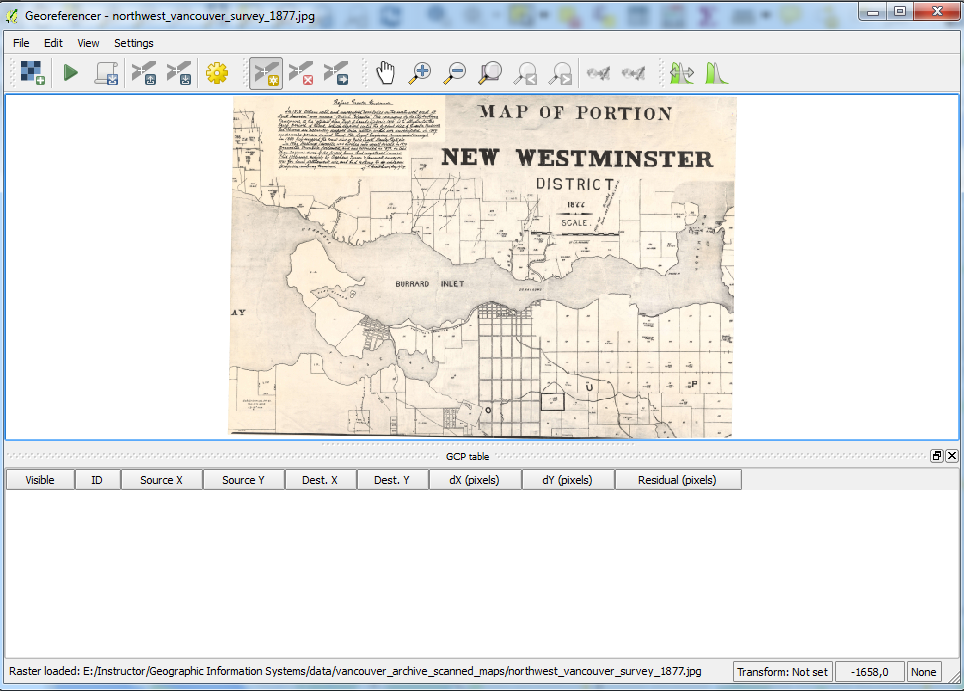
To add a control point, it is necessary to designate a point on the scanned map, shown in the top pane on Figure 1. How about Siwash Rock, a famous geological feature in Vancouver’s Stanley Park? That has probably not moved too far since 1877.
An “Enter map coordinates” dialog box (Figure 2) appears asking for the matching coordinates for this point on the map in the QGIS window. However it is not necessary to manually enter these, an easier alternative is to click the From map canvas button on the dialog box.
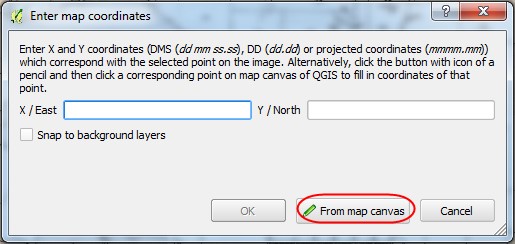
Clicking on Siwash Rock in the Google Map on the QGIS canvas creates points in both the scanned map and in the Google Map.

Figure 3: Selecting a Reference Point Using the QGIS Map Canvas
As well, the GCP table (Ground Control Points table) in the lower half of the Georeferencer tool records the point.
A few more clicks and software operations later, and the scanned map is georeferenced on top of the Google Map. A composite map has been created by setting the transparency of the scanned map to 50% so the user can see the present and the past mapping simultaneously.
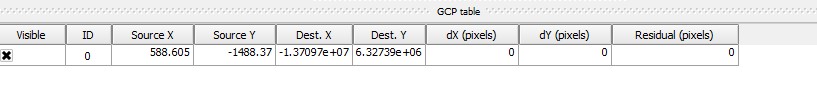
Figure 4: QGIS Ground Control Points Table

What can 1877 tell us about the current day and how can it prepare us for the future? Looking at the outline of the 1877 map we can see that much of False Creek today was originally water. Granville Island itself is a man made structure.
These facts are known to City of Vancouver planners, but such a map can help the City explain to the public the importance of taking steps now to avoid coastal flooding in the future. With the oceans predicted to rise 1-2 meters in the next hundred years, it is prudent to take action now.
Now zoom in to the West End and note District Lot 185. This is the lot that was purchased by “The Three Greenhorns”, a derisive name given to three English settlers who purchased the 540 acres comprising DL 185 for $550.75, because its future value was not recognized at the time.

Just think, if you had enough foresight and some extra cash in 1862, you could have bought the entire West End, now the site of some of the most expensive real estate in Canada and home to 40,000 residents!
As you can see from the preceding exercise, comparisons of historical and current maps within a GIS can be interesting and informative. If you would like to explore this topic further, try using your favorite search engine with the search terms “comparing modern and historic maps in gis” and you’ll find a number of relevant resources.
For Vancourites, another opportunity is to sign up for the Langara Continuing Studies course “Intro to Geopsatial Technology using QGIS” where we dig into this type of exercise in depth. Many courses and workshops in QGIS are available online and across Canada. A few examples from outside of B.C. are:
| Organization | Course/Workshop Name | Location | Dates |
| Quebec Centre for Biodiversity Science/ | Introduction to Geographic Information Systems with QGIS and GRASS
|
McGill University. Stewart Biology Building | November 9 and 13, 2015, from 9:30AM-4PM |
| Centre de la Science de la Biodiversité du Québec | Introduction aux systèmes d’information géographique avec des logiciels libres | Université de Montréal. Pavillon Roger-Gaudry | 30 et 31 mars 2016. De 9h30 à 16h30
|
| University of Alberta Faculty of Extension | Intermediate GIS | TBA | TBA |
If you keep an eye on the institutions mentioned in GoGeomatics Magazine’s Education section you’ll notice that many schools and other organizations are now offering education using QGIS and other Free and Open Source Software.
Comparing old maps with new has never been more accessible, easier, and less expensive than it is now. We all have access to many opportunies to access free software, free data, and free and inexpenisve training that will allow us to do so.

Be the first to comment