
- USGS releases first-ever map of potential for geological hydrogen in U.S.
- India to Set Up National Geospatial Mission
- Scientists brace ‘for the worst’ as Trump purges climate mentions from websites
- Mapping the impacts of U.S. tariffs on supply chains
- New Arctic Ocean map marks key milestone in global seafloor mapping project ‘Seabed 2030’
- Gulf of America’s shift won’t be the first time Google Maps has changes names depending on your location
USGS releases first-ever map of potential for geological hydrogen in U.S.
The United States Geological Survey (USGS) recently released a map of prospective hydrogen sites in the contiguous United States. Created by USGS geologists Geoff Ellis and Sarah Gelman, this map is based on their model which considers hydrogen sources, reservoir rocks and seal traps (locations hydrogen can be trapped) and then demonstrates locations of high hydrogen potential. While this model does not consider the practical or economical realities of extracting hydrogen, it provides a tool which could help in meeting the future energy needs of the United States.
Read more here:

India to launch National Geospatial Mission
Scientists brace ‘for the worst’ as Trump purges climate mentions from websites
Since the beginning of the second Trump Administration, information about climate change has been slowly disappearing from government websites. Information that was once readily available from agencies ranging from the Department of Defense to the Department of Transportation has been completely removed or otherwise relocated to less accessible areas. Researchers are also beginning to notice that previous studies with topics relating to climate change and green energy are being removed from government open databases. These moves match other steps taken by the Trump Administration to reduce regulations around climate change, such as the need for considering climate resiliency when providing federal infrastructure grants. Climate change resources and tools from the United States Department of Agriculture and the National Forest Service are also being discontinued.
Read more here

Mapping the impacts of U.S. tariffs on supply chains
US President Donald Trump’s proposal to impose 25% tariffs on imports from Mexico and Canada, along with 10% tariffs on imports from China, has the potential to disrupt trillions of dollars worth of trade between the United States and these three countries. One industry that could be particularly impacted is the North American auto sector. Through Bloomberg’s SLPC service, users can see a variety of information about supply chain data, including tables and maps.
Read more here:

New Arctic Ocean map marks key milestone in global seafloor mapping project ‘Seabed 2030’
Seabed 2030 is an initiative that was launched in 2017 with the goal of mapping the entire world’s seafloor. After extensive mapping and an update to the International Bathymetric Chart of the Arctic Ocean, 1.4 million sq km of Arctic Ocean seafloor is now available to the public. In the past, it has been challenging to map the Arctic floor due to the harsh climate, but with advances in technology, this mapping has become easier in recent years. Mapping the ocean floor is vital for a variety of reasons, including marine transportation, natural resource extraction, and global climate and weather prediction models. So far, 25% of the world’s ocean floor has been mapped under Seabed 2030.
Read more here:

Gulf of America’s shift won’t be the first time Google Maps has changes names
In response to President Trump’s Executive Order, Google Maps has announced it will be changing the Gulf of Mexico to the Gulf of America for American users of the application. While those in Mexico will continue to see the old name, users in other countries will see both names listed on the body of water. Google Maps has also announced the change of the Alaskan mountain Denali to Mount McKinley.

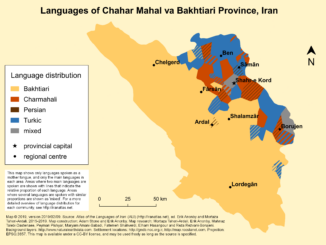
The names of physical features carry historical and political weight. Google Maps responds to these complexities by using different names in different regions — for example, the body of water known as the Persian Gulf in Iran is named the Arabian Gulf in Saudi Arabia and other Arab countries.
Read more here:
Be the first to comment