Anne Krahnen – Cartographer and GIS Specialist
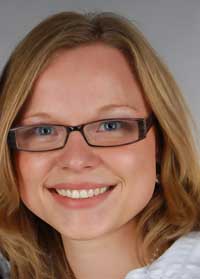
GoGeomatics Canada recently had the pleasure of interviewing Anne Krahnen! Anne is a Cartography and Geomatics specialist and is currently working on her Master’s degree at the University of Regina. Check out some of the maps Anne has created during her Master’s degree!
GoGeomatics: Tell us a little bit about yourself. How did your interest in Geomatics start?
Anne: My name is Anne Krahnen. Originally, I am from Germany where my passion for Geomatics started.
As a little kid, I was already fascinated by maps and ever since maps are a part of my life. When I went on trips with my family, I always wanted to know where we were, where we were going to and how we would get there. Treasure hunts with self-made maps were another passion of mine. I loved drawing maps and making them look antique and withered. Little did I know at that time about map making and Geomatics. It was just before finishing high school when I learned that the University of Applied Sciences in Karlsruhe offers a program with the name Cartography and Geomatics. I was thrilled and convinced that this is what I want to do. The program was intense but from the first day I loved every minute of it. I learned passionately about thematic and topographic mapping, map design, GIS, remote sensing, typography, and much more.
After finishing my Bachelor with honours, I decided to apply for a Master’s programs. I wanted to continue to focus in Cartography and Geomatics and decided to do research on the optimization of population maps using the dasymetric method at the University of Regina.
GoGeomatics: How are you using Geomatics in your current position?
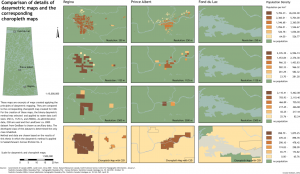
Anne: Currently I am working on my MSc thesis about the “Cartographic Visualization of Saskatchewan’s Population using Dasymetric Mapping”. For my thesis I am applying different dasymetric techniques using GIS. Doing this, I am improving the quality of population maps visually and quantitatively when compared to the traditionally applied choropleth method.
This example shows excerpts of a dasymetric method applied to Saskatchewan at different resolutions. The corresponding choropleth maps for these excerpts are provided:
During the past years, I was also involved in several mapping projects at the University of Regina and I was working at the university’s library as a GIS Technician. Most of these projects involved spatial analysis using GIS technology and map creation.
GoGeomatics: What skill types have you gained in this field and are they transferable to other types of industries?
Anne: I am passionate about visualizing complex spatial relations in organized and structured ways. Spatial analysis and thematic mapping is what I am most passionate about. Displaying various topics and thinking of new creative ideas to create interesting maps is something I really like. I believe that we need visually attractive maps that are designed in smart ways. To realize this, multiple platforms and layers have to be considered. I believe that in our globalized world, thematic maps are used and required in any industry.
GoGeomatics: Do you have any examples of your past or present GIS work that you are willing to share with us (maps, websites, drawings) and can you provide us a brief explanation?
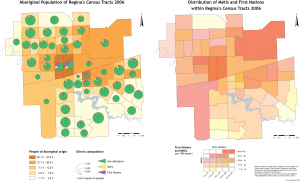
Anne: The first two maps were created for an assignment in a population geography class. I examined racial segregation (regarding Aboriginal population) in Regina, Saskatchewan and used the two maps to explain and support the results of my study. The map on the left hand side shows census tracts with high percentage and lower percentage of Aboriginal population within the city. This map also shows non-Aboriginal, Métis and Aboriginal population in absolute numbers. The map on the right hand side compares directly the ratio of Métis and First Nations population. A two-dimension colour scheme was chosen to directly compare the numbers: Generally it can be said that the darker the color, the more aboriginal population is located in one Census Tract. Yellow colours indicate higher percentage of First Nations population and pink colours show a higher percentage of Métis population.
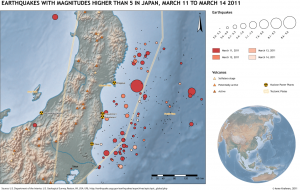
The second map was created after the 2011 earthquake and tsunami in Japan. It was intended to show the extent of earthquakes just four days after the disastrous earthquake:
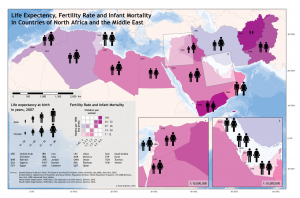
The map showing life expectancy at birth, fertility rates and infant mortality rates in parts of Nothern Africa and the Middle East, is part of a map series on this region of the world. Life Expectancy is shown for both, men and women. Infant mortality rate and fertility rates are visualized with a bi-polar color scheme, which gives even more information since these variables are closely related:
One of my latest GIS projects is an interactive map for Health Report Cards (http://www.uregina.ca/admin/faculty/Lockhart/hsrc/map.html) annually published by Dr. Wallace Lockhart. The map was created with Adobe Flash and is designed to load the information interactively. This way, the map can be updated and new information can be integrated semi-automatically. The map includes both, information for the provinces, as well as Health Regions.
GoGeomatics: What do you find rewarding/challenging in your GIS career?
Anne: I enjoy working with GIS as it allows displaying spatial data cartographically. It is great to work with these developing tools. It creates constant challenges and requires continuous learning, but in the end, it is the best feeling to master a new technology or manage to complete a complex project. I particularly enjoy finding ways to create thematic maps displaying and explaining relationships or dependencies between variables. It is great to create a visual level for data making data and analysis more accessible.

