
- Geodesy moves into everyday workflows
- Cool Cities Lab turn urban heat data into real decisions
- The limits of satellite flood monitoring
- Using geospatial data to guide emergency blood deployment
- Brazil and FAO simplify access to forest monitoring data
- DESI completes the largest 3D map of the universe
Geodesy moves into everyday workflows
Blue Marble’s latest release of Global Mapper 27 is pushing a quiet but important shift in geospatial workflows. By integrating GeoCalc directly into the platform, high-precision coordinate transformations, validation, and geodetic analysis can now happen within a single environment, rather than across multiple tools. This software update is very important because it reflects a broader move toward embedding geodetic rigor into everyday workflows, not just specialized processes.
For the North American geospatial community, especially with ongoing modernization of reference systems like CSRS and NSRS, this signals where the industry is heading. Accuracy is no longer an add-on. It is becoming a default expectation built into the tools professionals use daily. As workflows become more unified, the line between geodesy and applied GIS continues to blur.
Cool Cities Lab turn urban heat data into real decisions
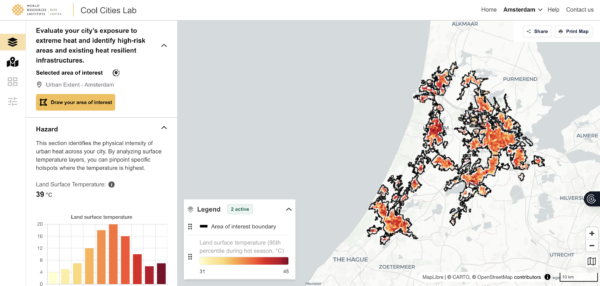
A new platform called Cool Cities Lab is trying to solve a problem many cities quietly struggle with. There is a lot of data on urban heat, but very little of it actually translates into clear, actionable decisions. This tool brings together open data, visualizations, and simple modeling to help city officials identify where heat risk is highest and test interventions like tree planting or cool roofs before implementing them.
What stands out is not just the data, but the usability. It is designed with decision-makers in mind, not just analysts. This points to a broader shift in geospatial work. Tools are moving beyond analysis and into directly shaping decisions around infrastructure, policy, and climate resilience.
The limits of satellite flood monitoring
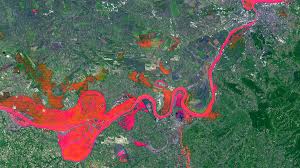
As flooding becomes more frequent and unpredictable, satellites are playing a bigger role in monitoring what is happening on the ground. But this piece highlights a key limitation. No single satellite can fully capture a flood event. Different sensors each come with trade-offs. Optical satellites struggle with cloud cover, radar can miss peak flooding depending on timing, and high-frequency data often comes at the cost of spatial detail. This creates what researchers describe as a constant balancing act between resolution, coverage, and timing.
The result is that flood monitoring today relies on combining multiple data sources rather than depending on one system. It is a reminder that even with advances in Earth observation, there are still fundamental limits to what can be seen from space in real time.
Using geospatial data to guide emergency blood deployment
A new study is showing how geospatial analysis can be used to save lives before patients even reach the hospital. By mapping where severe trauma cases occur and linking that with blood transfusion data, researchers identified clear patterns in where emergency blood is most needed. Instead of distributing blood randomly or evenly, this approach allows emergency services to position limited supplies in the areas with the highest demand.
What stands out is how simple the idea is. The data already exists in most hospital systems. The value comes from putting it on a map and actually using it to guide decisions. It also highlights how spatial patterns often intersect with social factors, with higher trauma rates concentrated in lower-income areas.
Brazil and FAO simplify access to forest monitoring data
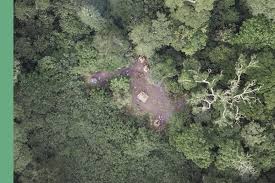
Brazil and the FAO are working to strengthen how forest data is accessed and used, not just how it is collected. Alongside updates to Brazil’s long-standing forest monitoring program, they introduced a new QGIS plugin that simplifies access to land use and deforestation data. Instead of requiring technical expertise to navigate complex datasets, the tool allows users to filter, visualize, and work with official environmental data more easily. What stands out here is the focus on usability. The data has existed for years, but making it easier to access changes who can actually use it and how quickly it can inform decisions.
It reflects a broader shift in geospatial work, where the challenge is no longer just producing data, but making it usable for policy, research, and on-the-ground action.
DESI completes the largest 3D map of the universe
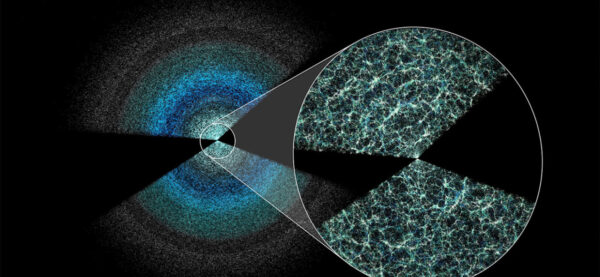
After five years of observations, the Dark Energy Spectroscopic Instrument (DESI) has mapped more than 47 million galaxies and quasars, creating the most detailed 3D map of the universe so far. What makes this significant is not just the scale, but what it enables. By tracking how galaxies are distributed across space and time, researchers can study dark energy, the force driving the expansion of the universe. Early results are already hinting that dark energy might not be constant as previously thought.
Even more interesting, the project is continuing beyond its original plan, expanding the map and pushing deeper into some of the biggest unanswered questions in physics. It is a reminder that mapping is not just about the Earth. The same principles scale all the way to the universe.
Be the first to comment