
What is a data cube and how is it used for big data analytics?
How does a data cube work with remotely sensed data?
Before writing this article I had never heard of a data cube nor the Google Earth Engine (GEE). What stirred my interest was the fact Natural Resources Canada (NRCan) had begun to engage with the Canadian geomatics community on creating a data cube of our own. If you follow this link you will see the call for participation in a workshop, “CCRS in Ottawa: Big Geospatial Data Analytics Workshop“ from late last year.
It seems the Canadian government believes data cubes are important and wants us to have one of our own. That led me to ask the question “But what is a data cube?” I’m a fairly newly minted Canadian geospatial practitioner and I know nothing about this whole data cube concept. In order to explore the topic I have decided to look at one that is already up and running. So join me as I take a look at the Google Earth Engine and how it works and how it can be used.
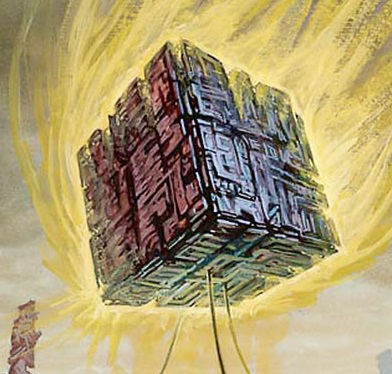
In General Terms What is a Data Cube?
Although the data cube concept is complex, I will try to explain it as simply as possible. Essentially the term “data cube” refers to the idea that we can take take massive amounts of remotely sensed data, like Landsat for instance over 30 years, and then stack the data over time to answer questions that otherwise might be too computational intensive for a regular system. Using a data cube we could do an analysis like: how have shorelines changed over the last 30-40 years in Canada?
So we are talking about vast amounts of geographic data over a large amount of time. This is a simplistic explanation but one we can all grasp out of the gate. I actually had a really hard time finding a clear definition of a data cube so if anyone has one please add it to the comments.
Google Earth Engine
Google describes the Google Earth Engine as:
“Google Earth Engine combines a multi-petabyte catalog of satellite imagery and geospatial datasets with planetary-scale analysis capabilities and makes it available for scientists, researchers, and developers to detect changes, map trends, and quantify differences on the Earth’s surface.”
GEE was first introduced in December 2010 at the International Climate Change conference in Cancun, Mexico. Google has created a YouTube video introducing GEE that I found quite informative.
One of the reasons I picked the GEE to explore was that it has a fairly simple process to get access to the system. Users can request access by filling out a form on the website https://earthengine.google.com/signup. They don’t accept everybody so don’t hold your breath. I’m not sure how they decide who gets in or not. The system is free for nonprofits and educational purposes so your school should be able to get you access.
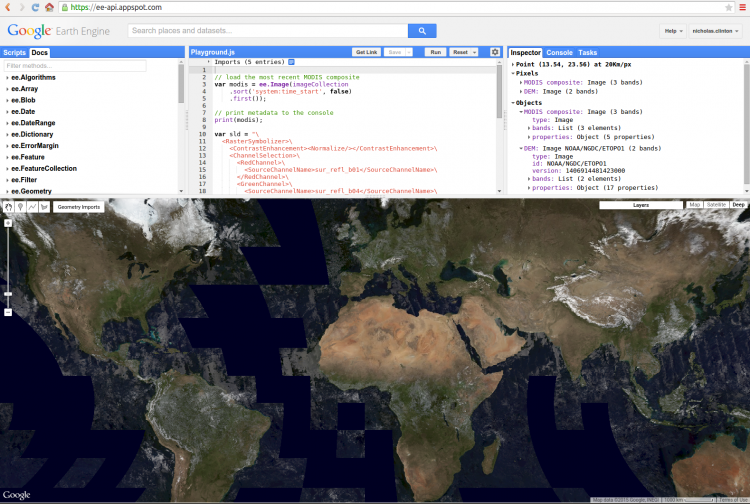
Once inside you and I can use the GEE by utilizing the web developer interface that combines map output in one window for large scale geospatial data. As described by Google, it is Satellite Imagery + Your Algorithms + Real World Applications.
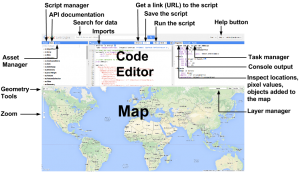
Google Code Editor
GEE uses java script or python to run the scripts and scripts are developed within the Code Editor. Google has created tutorials that show how to use GEE, focusing on Java Script programming.
Data Categories
Google has also created a data catolog which can be browsed and searched, which contains all of the data available to be used with GEE. This data is broken into 4 main categories:
- Imagery: Landsat (30 meter resolution), Sentinel, MODIS (Moderate Resolution Imaging Spectroradiometer) and High- Resolution Imagery
- Geophysical: Terrain including DEM (Digital Elevation Models) and global DEMs such as Shuttle Radar Topography Mission (STRM), Land Cover, Cropland, surface temperature, global forest change, biomass estimates, burned areas and vegetation continuous fields. Also includes alert- driven datasets like Fire Information for Resource Management System (FIRMS).
- Climate Weather: Atmospheric data (ozone data), Forecast data NOAA’s Global Forecast System (GFS) and NCEP Climate Forecast System (CFSv2), sensor data like tropical Rainfall Measuring Mission (TRMM).
- Demographic Data: WorldPop (population density data) and Malaria data.
Case Study: Global Tree Cover Change
Google has completed several case studies illustrating how GEE provides solutions to real world problems. One such case study is the Global Tree Cover Change project.
The study focused on global tree cover extent, loss and gain from 2000-2012. Over 143 billion pixels of Landsat data were used to cover the study area of 128.8 million km2, excluding areas of Antarctica and some Arctic islands. The goal for the team was to quantify global land dynamics and they created a 30 meter resolution global thematic map – the first of its kind!
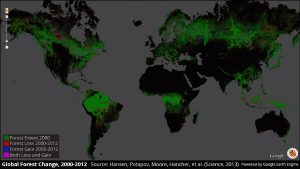
For this project Google estimates the processing GEE completed over a period of a few days would have taken a single computer 15 years to process. GEE processed 20 terapixels of Landsat data using one million CPU-core hours on 10,000 computers in parallel. As a result, this study determined 2.3 million square kilometers of forest was being lost and 0.8 million square kilometers was gained. It was also determined that even with the reduction of deforestation in Brazil, deforestation also occurring in other countries such as Indonesia, Malaysia, Tanzania, Angola, Peru and Paraguay is contributing to a loss of tropical forest.
The researchers created an interactive map, which allows the user to view different results for the study (http://earthenginepartners.appspot.com/science-2013-global-forest). This one case study illustrates how GEE can improve processes and produce solutions to real world problems.
In Conclusion:
By looking at the GEE we now can see why a data cube is useful for big data analytics. It is important because it allows the end-user to obtain answers to really large questions. It does this by quantifying the satellite imagery into maps and models over vast geographies and periods of time. By being able to analysis large amount of satellite imagery and requiring shorter processing times, solutions for many real life applications are now possible.
I believe that technology can be a game changer for Canada. We used to lead the world when it came to remote sensing but have fallen behind. This isn’t about leading anymore but it is about having a seat at the table, we need to have own data cube. We should be interested in the efforts of the Canadian government to create our own data cube because it allows Canadians to use data generated in Canada for issues that face us at home and globally. In the future I hope to talk to NRCan about efforts at home to develop our own data cube.
Sources:
Australian Geoscience Data Cube, 2017. Australian Geoscience Data Cube. Retrieved from http://www.datacube.org.au/
Hansen, Potapov, Moore, Hancher et al (November 14, 2013.). Global Forest Change, Interactive map. Retrieved from http://earthenginepartners.appspot.com/science-2013-global-forest
Hansen, Potapov, Moore, Hancher et al (2013). High Resolution Global Maps of 21st –Century Forest Change. Science (6160), pp. 850-853
Google Earth Engine Team, 2015. Google Earth Engine: A planetary-scale geospatial analysis platform. Retrieved from https://earthengine.google.com
Google (September 8, 2016). Google Earth Engine API. Retrieved from https://developers.google.com/earth-engine/
Google, December 2, 2010. Introducing Google Earth Engine. Retrieved from https://googleblog.blogspot.ca/2010/12/introducing-google-earth-engine.html
Google Research Blog, November 14, 2013. The first detailed maps of global forest change. Retrieved from http://research.googleblog.com/2013/11/the-first-detailed-maps-of-global.html
National Aeronautics and Space Administration (NASA), March 2017. Section 2.3 The ABoVE Science Cloud (ASC). Retrieved from http://above.nasa.gov/sciencecloud.html
Techopedia Inc. (2017). Data Cube. Retrieved from https://www.techopedia.com/definition/28530/data-cube

Be the first to comment